> ## Documentation Index
> Fetch the complete documentation index at: https://help.decodo.com/llms.txt
> Use this file to discover all available pages before exploring further.
# Usage Statistics
> Datacenter Pay/IP Proxy Traffic Usage Statistics
Datacenter Pay/IP proxy traffic usage details can be found on your dashboard statistics page. Simply navigate to the Datacenter Pay/IP proxy page via the dashboard left panel and click on the [**Usage statistics**](https://dashboard.decodo.com/datacenter-ips/statistics?) section.
If you're interested in learning how traffic is counted, head over to [**Traffic usage**](https://help.decodo.com/docs/proxy-traffic).
***
## Statistics data line graph
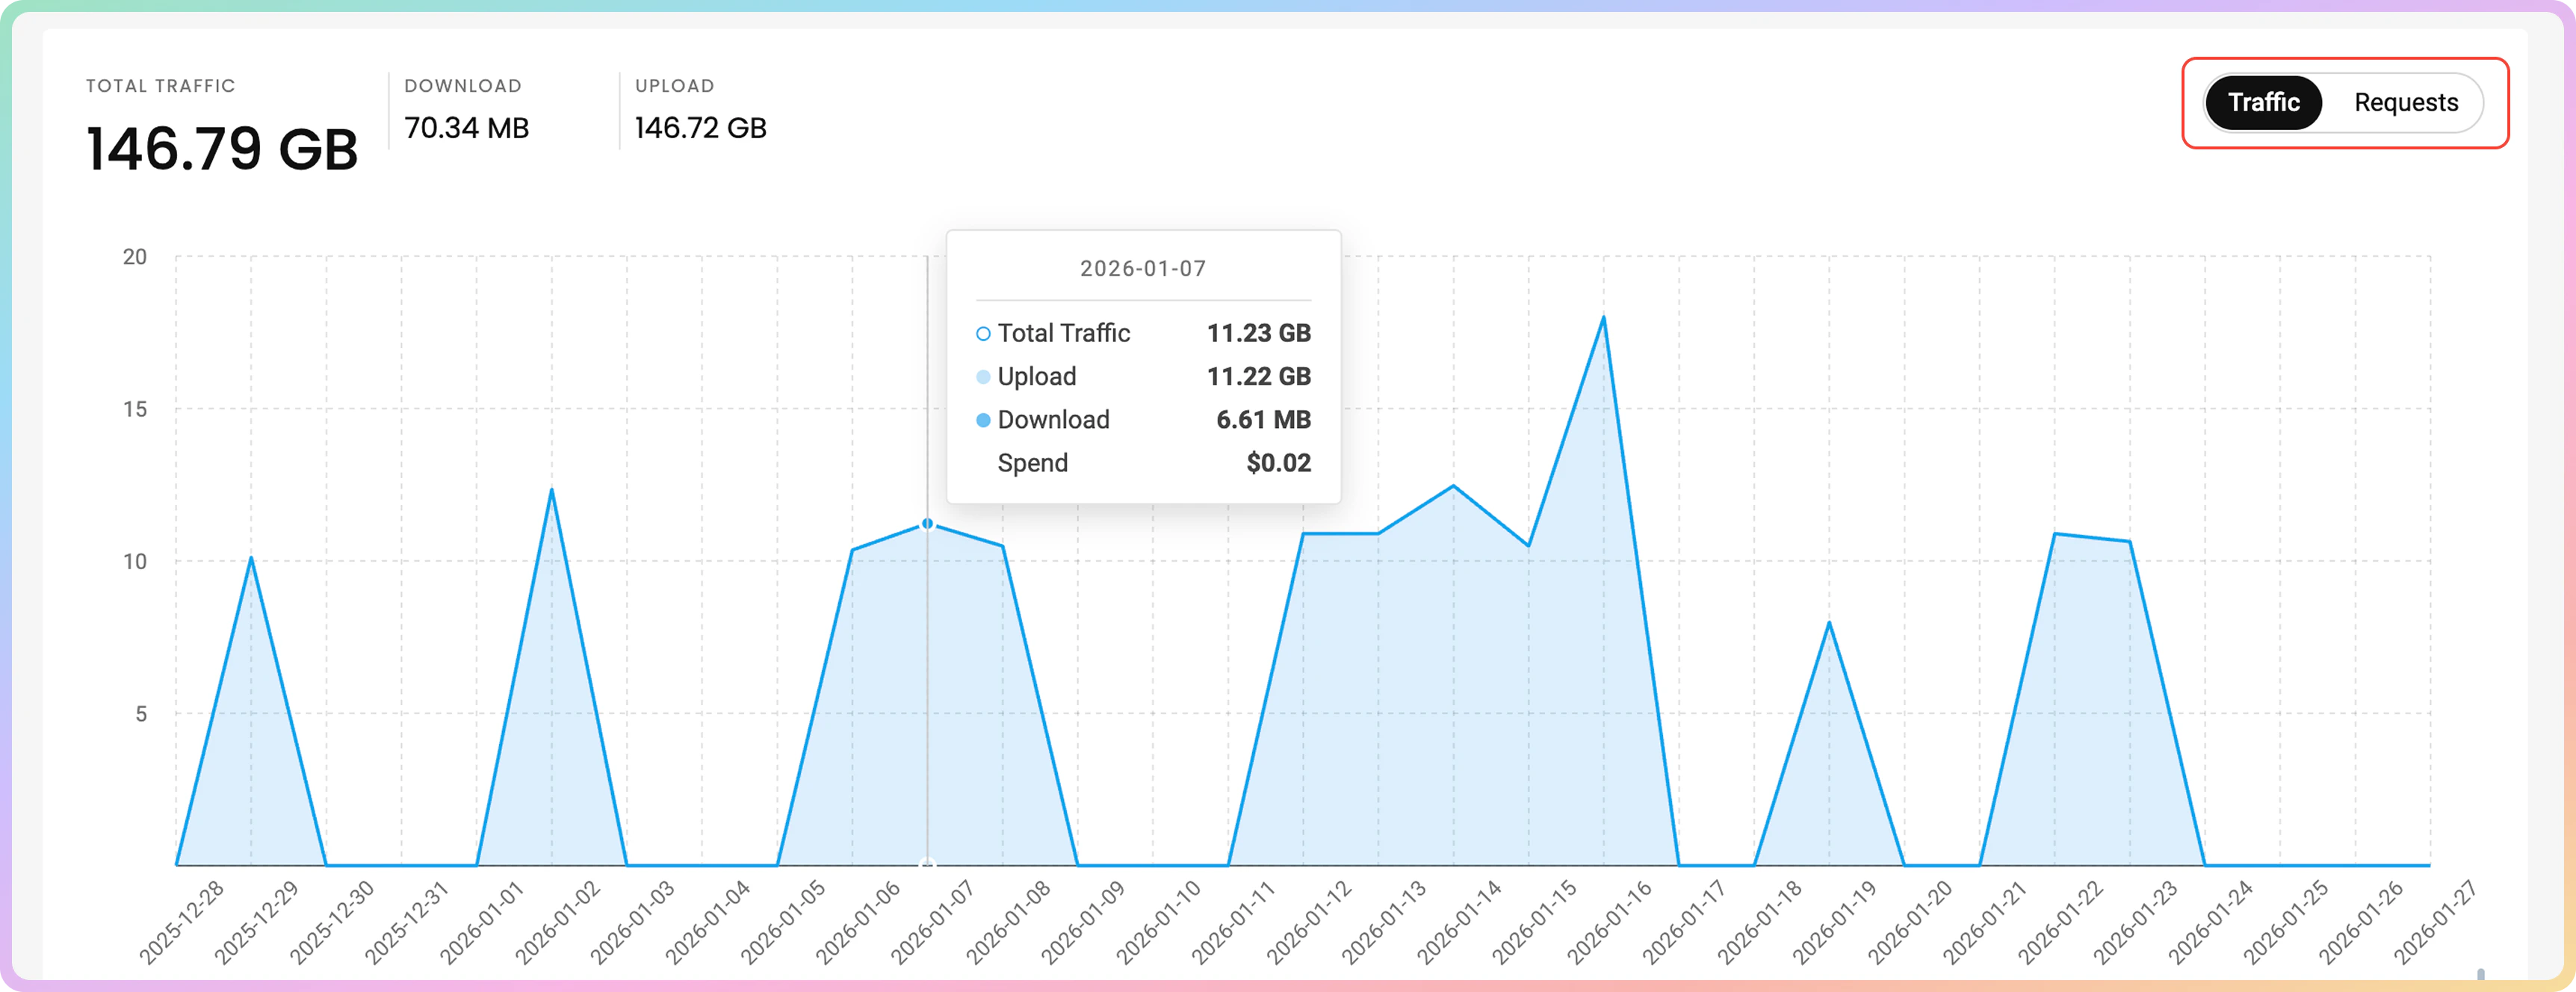
You will see a line graph, which displays your total **Traffic** or **Requests** sent with the proxies.
Usage data is updated every 10 to 15 minutes. Statistics are provided in the UTC time zone.
* In the **Traffic** line graph, the vertical axis shows the used traffic in `MB` and/or `GB`, whereas the horizontal axis shows the time you grouped by.
* You can hover over the data points in the line graph to see detailed usage for the selected time.
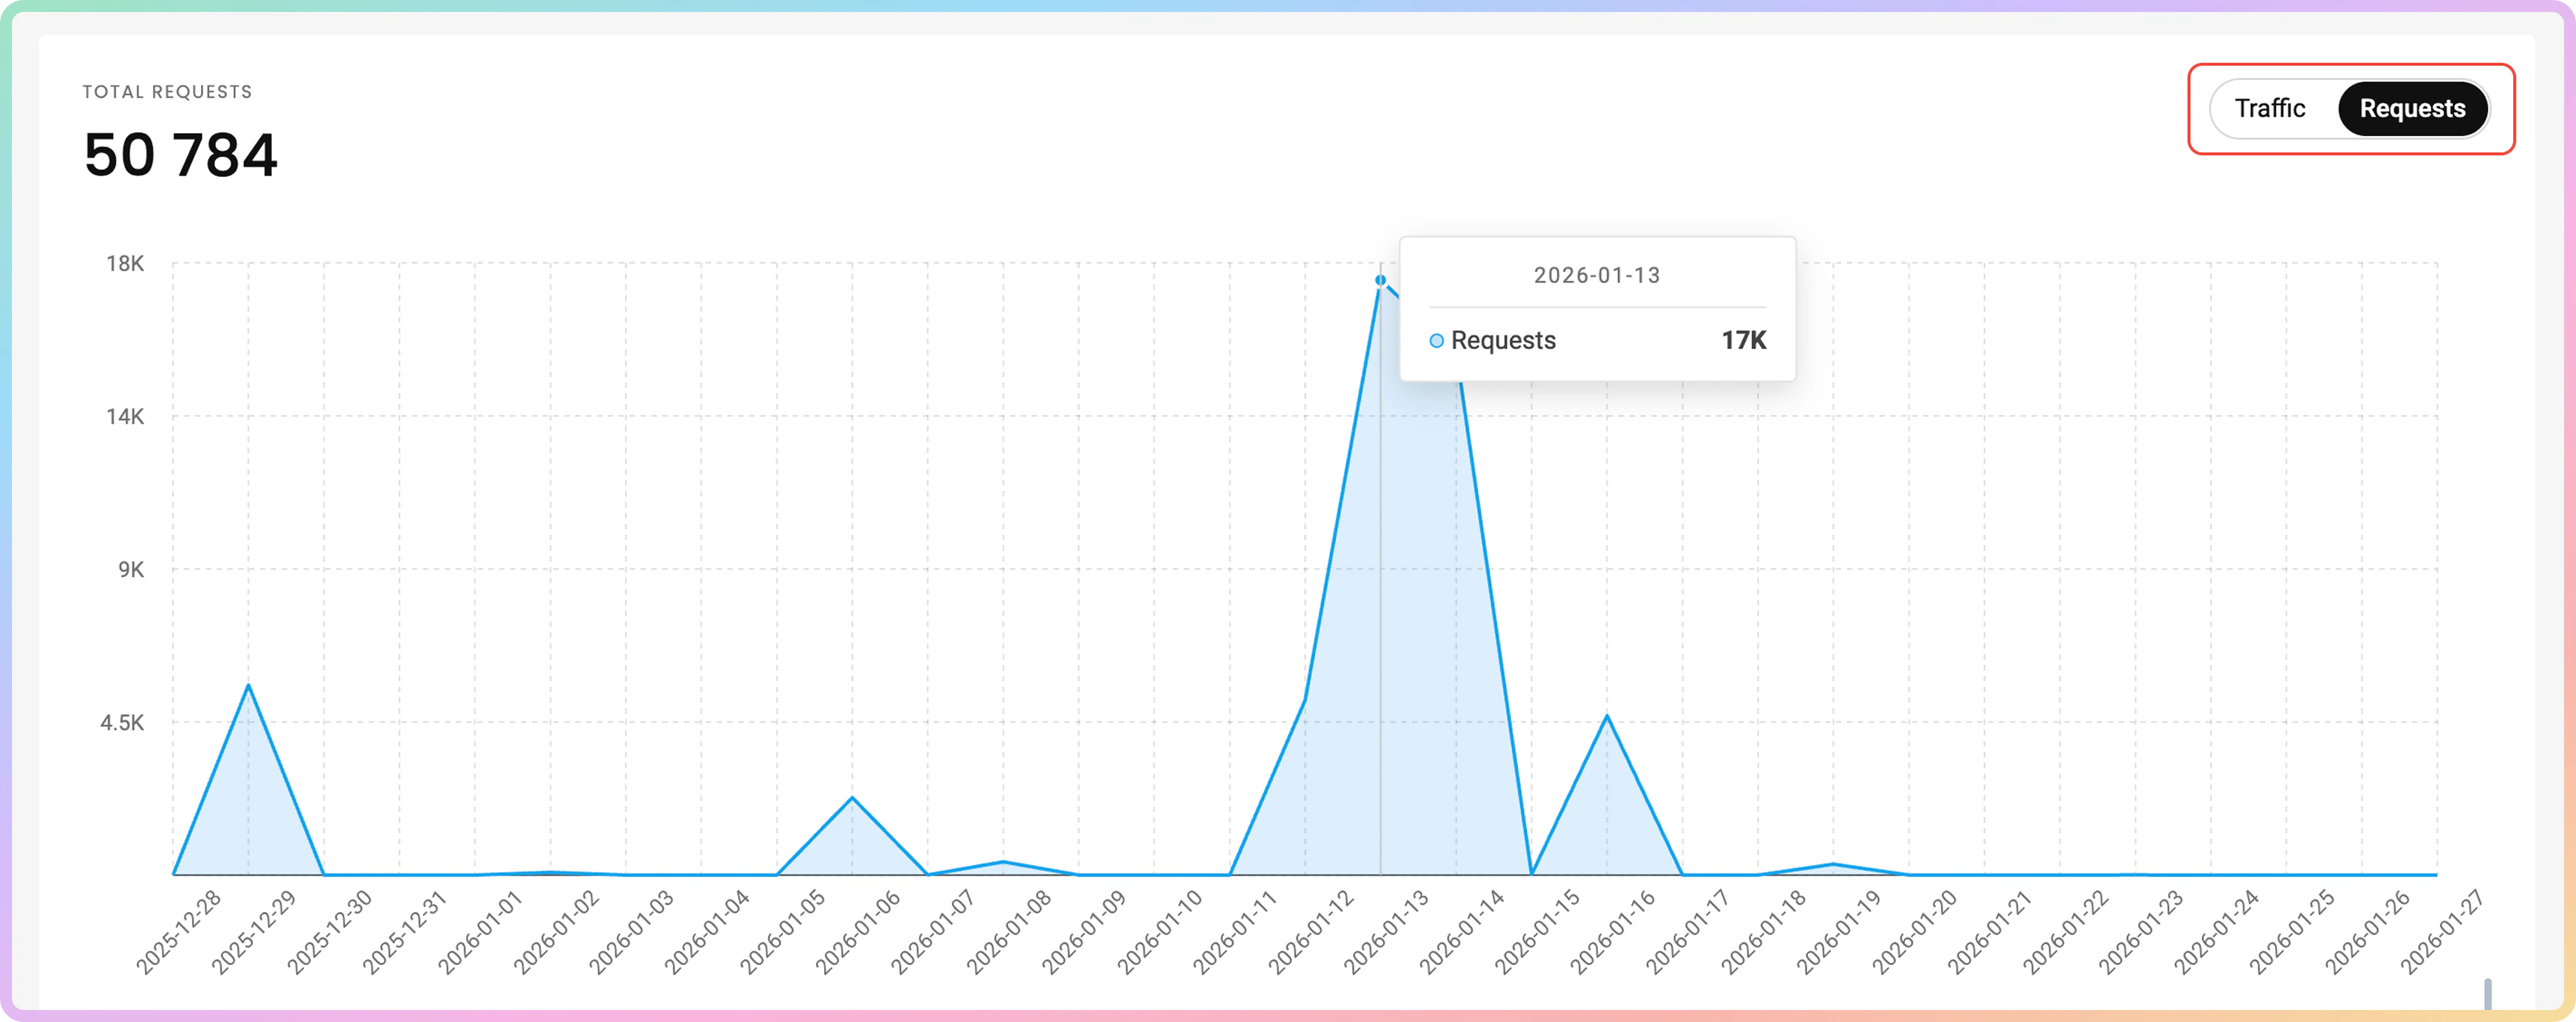
 * In the **Requests** line graph, the vertical axis shows the count of requests sent with the proxies, whereas the horizontal axis shows the time you grouped by.
* You can hover over the data points in the line graph to see detailed usage for the selected time.
* In the **Requests** line graph, the vertical axis shows the count of requests sent with the proxies, whereas the horizontal axis shows the time you grouped by.
* You can hover over the data points in the line graph to see detailed usage for the selected time.
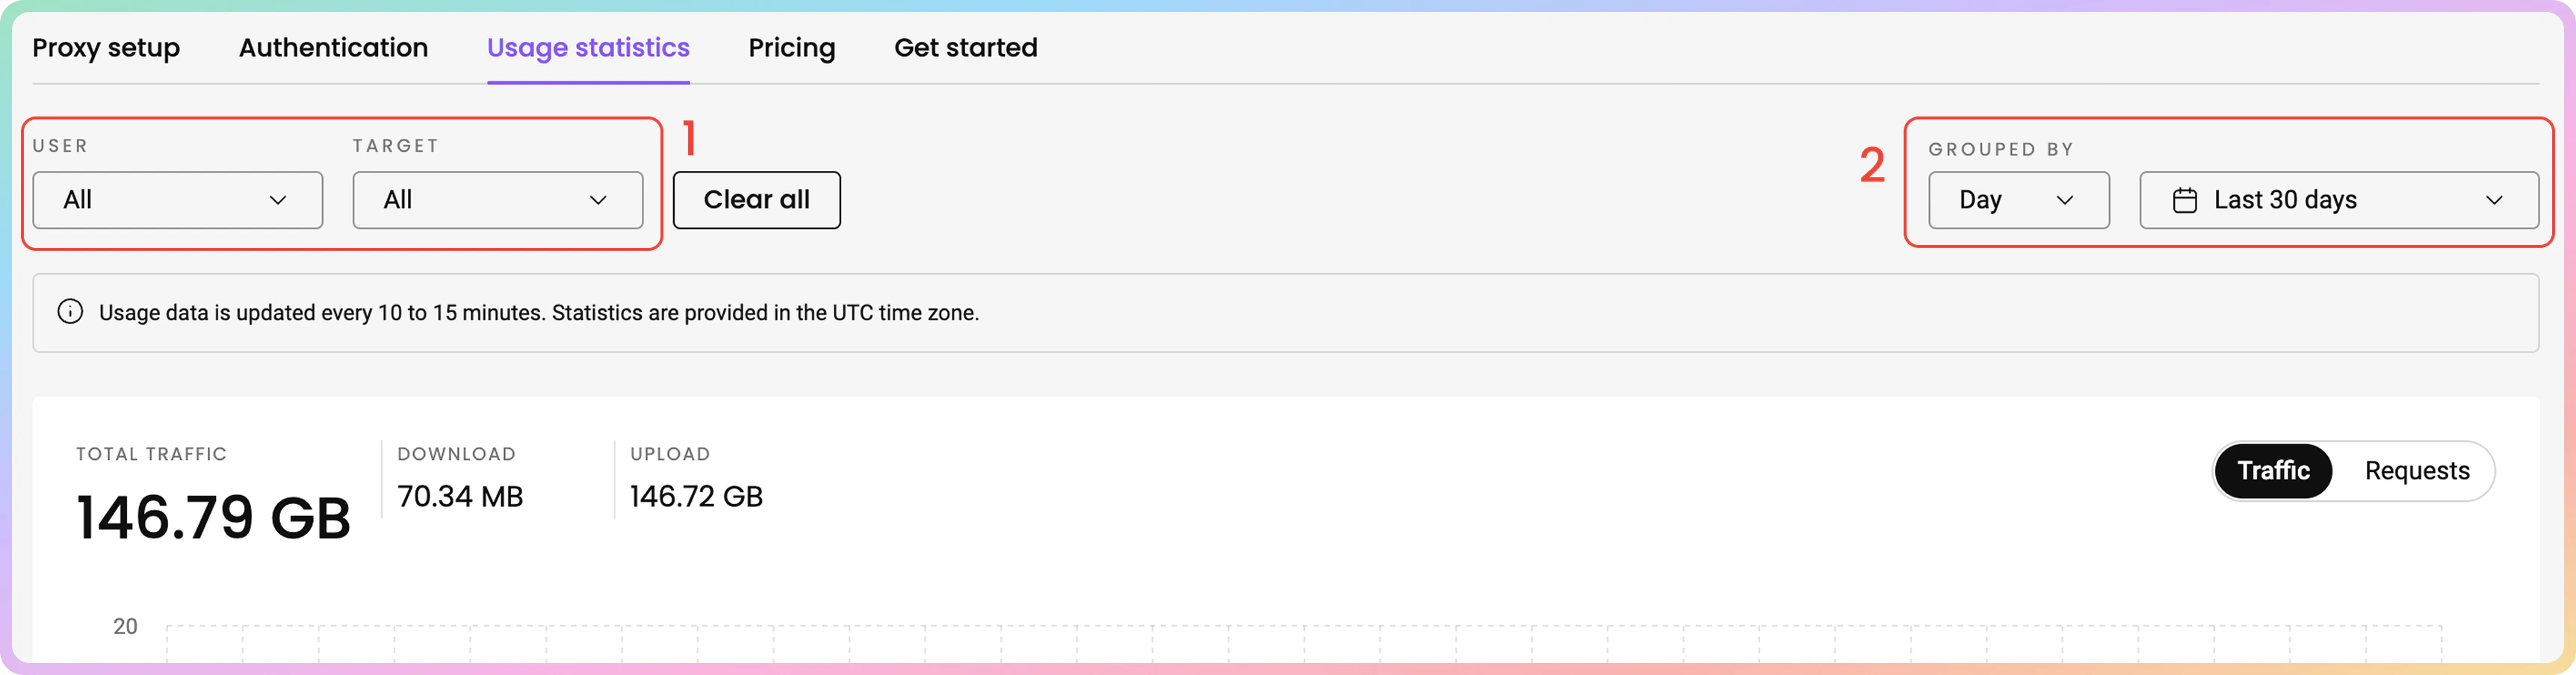
 1. You can choose to sort the data by proxy **User** and **Target**.
2. You can also group the data by **day**, **week**, or **month**.
Traffic history is limited to a maximum of 180 days.
1. You can choose to sort the data by proxy **User** and **Target**.
2. You can also group the data by **day**, **week**, or **month**.
Traffic history is limited to a maximum of 180 days.
 ***
## Statistics data table
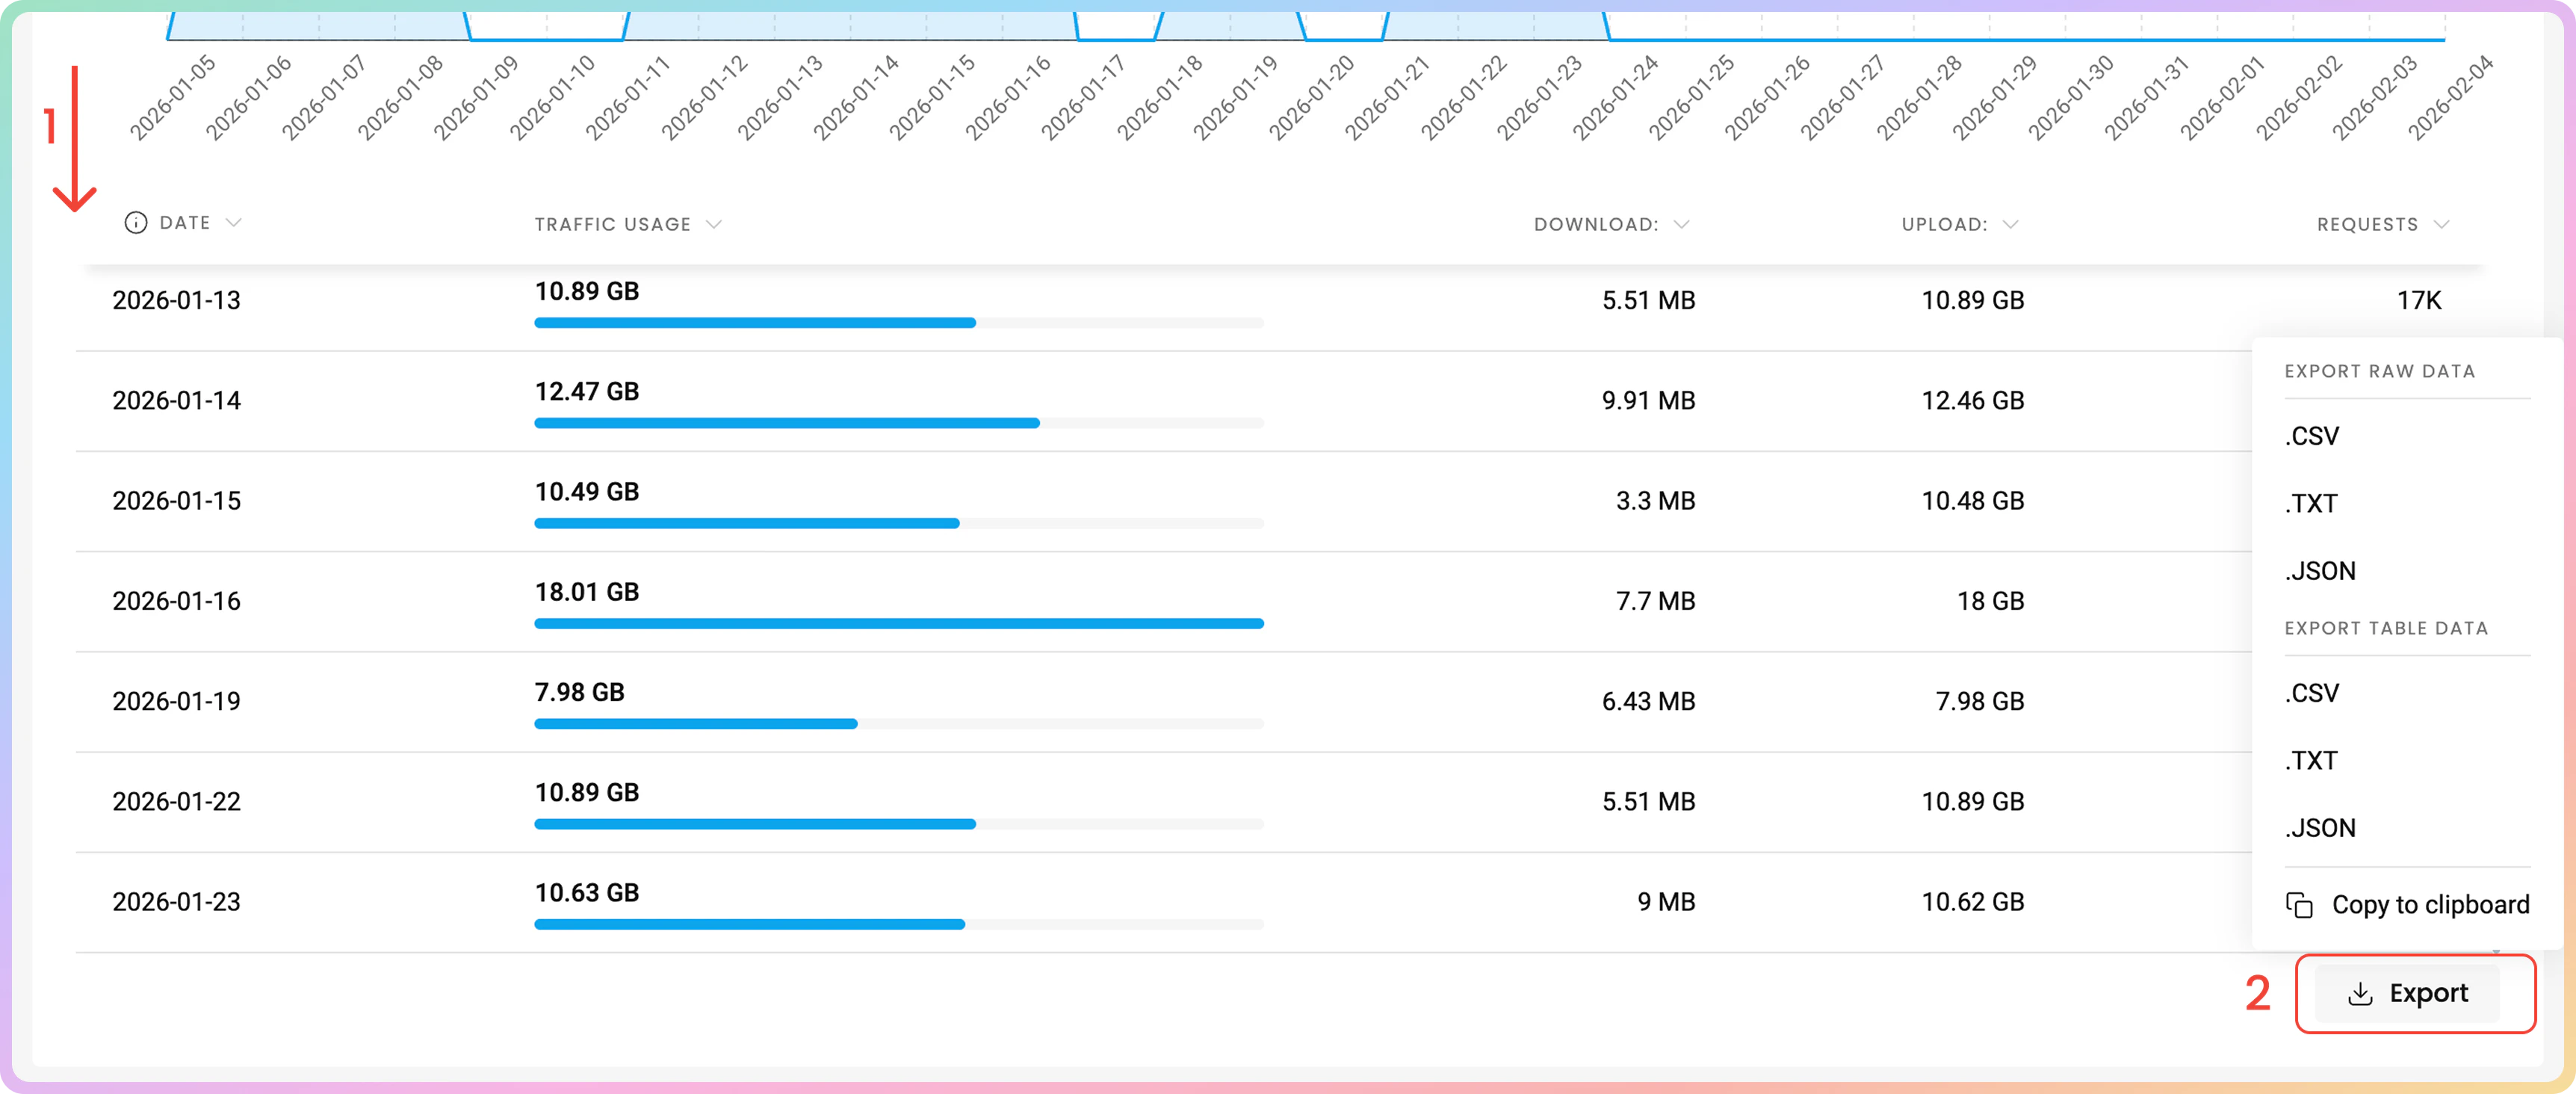
Below the line graph, you can view the data table that summarizes the traffic used with the proxies.
1. You can find the **Date**, **Traffic Usage**, **Download**, and **Upload** traffic in `MB` or `GB`, and **Requests**.
2. You can export the table's data directly or export the raw data in the following file formats: `.CSV`, .`TXT`, or `.JSON`. You can also copy the data to your clipboard.
***
## Statistics data table
Below the line graph, you can view the data table that summarizes the traffic used with the proxies.
1. You can find the **Date**, **Traffic Usage**, **Download**, and **Upload** traffic in `MB` or `GB`, and **Requests**.
2. You can export the table's data directly or export the raw data in the following file formats: `.CSV`, .`TXT`, or `.JSON`. You can also copy the data to your clipboard.
 Below are four additional data tables: **Top targets**, **Top countries**, **Top users**, and **Top IPs**.
### Top targets
In the **Top targets** table, you can see the target domains, which you have accessed with the proxies, sorted by total traffic consumption in descending order.
1. You can find the **No.**, **Target**, **Traffic**, and **Requests** columns as well.
2. To view the full target list, click on the **All targets list** button located at the top right corner of the table.
* There, you can search the entire list by keywords.
Below are four additional data tables: **Top targets**, **Top countries**, **Top users**, and **Top IPs**.
### Top targets
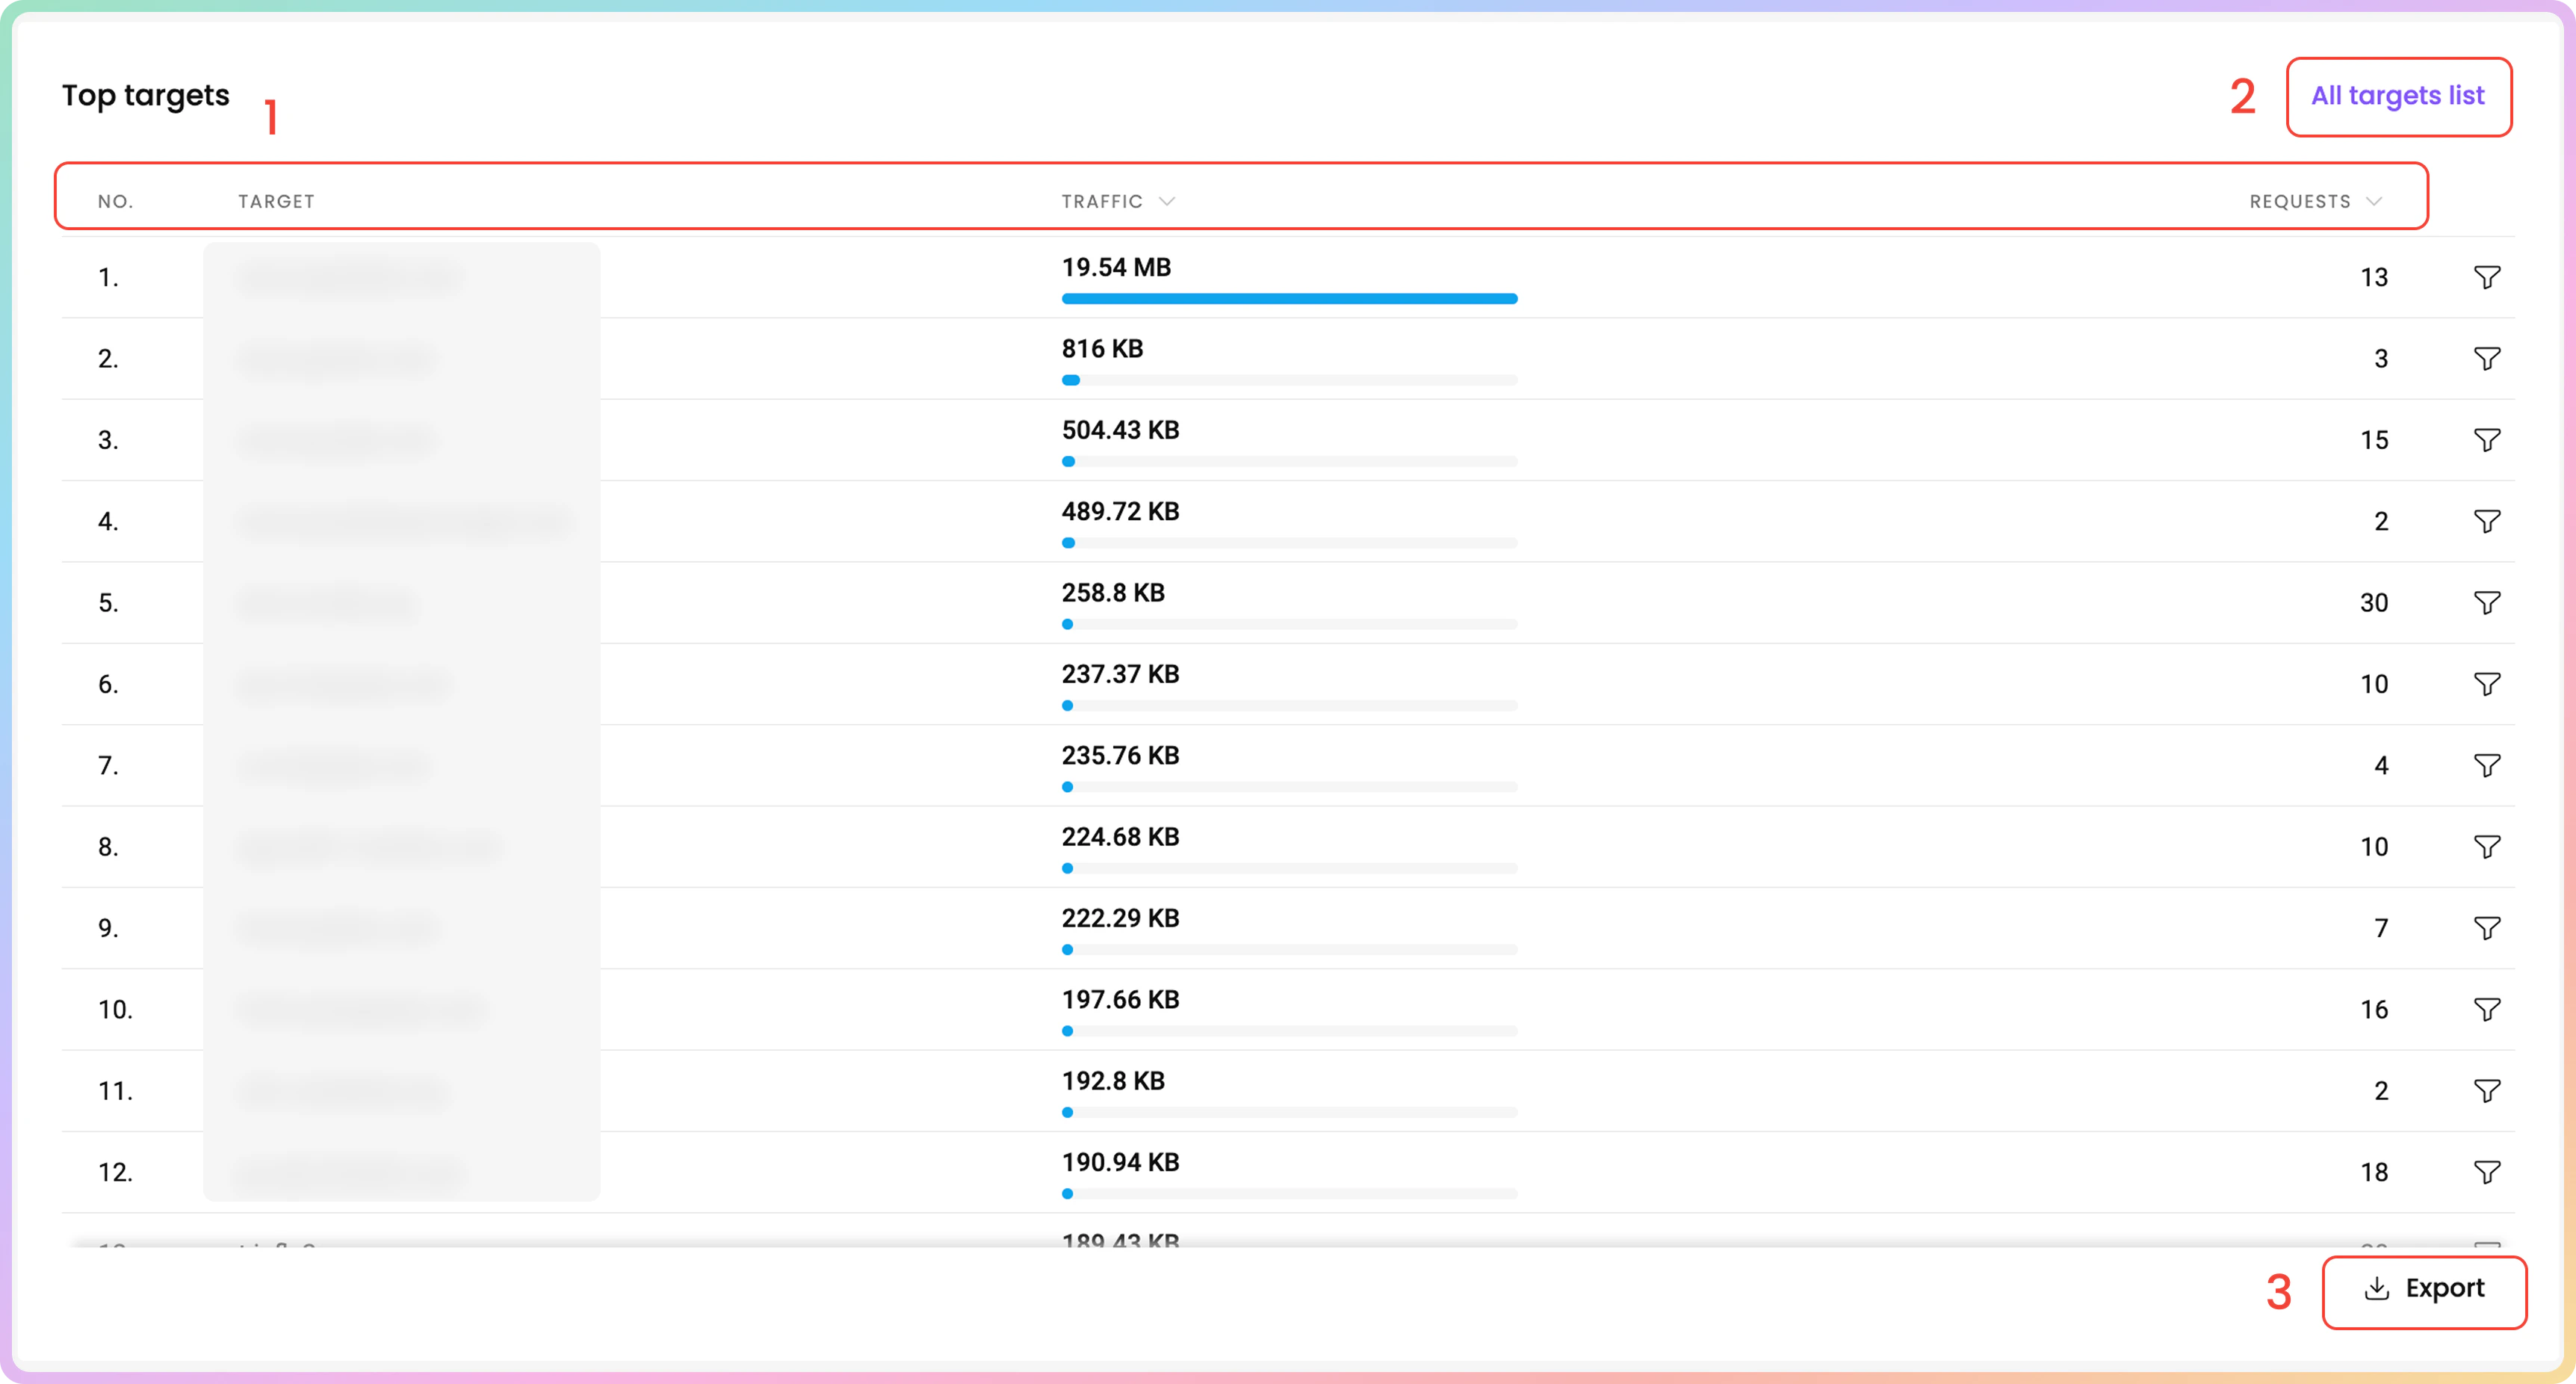
In the **Top targets** table, you can see the target domains, which you have accessed with the proxies, sorted by total traffic consumption in descending order.
1. You can find the **No.**, **Target**, **Traffic**, and **Requests** columns as well.
2. To view the full target list, click on the **All targets list** button located at the top right corner of the table.
* There, you can search the entire list by keywords.
 3. You can export the table's data directly or export the raw data in the following file formats: `.CSV`, .`TXT`, or `.JSON`. You can also copy the data to your clipboard.
 ***
### Top countries
In the **Top countries** table, you can see the countries you have targeted with the proxies, sorted by total traffic consumption in descending order.
1. You can find the **Country**, **Traffic**, and **Requests**.
2. To view the full target list, click on the **All countries list** button located at the top right corner of the table.
* There, you can search the entire list by keywords.
***
### Top countries
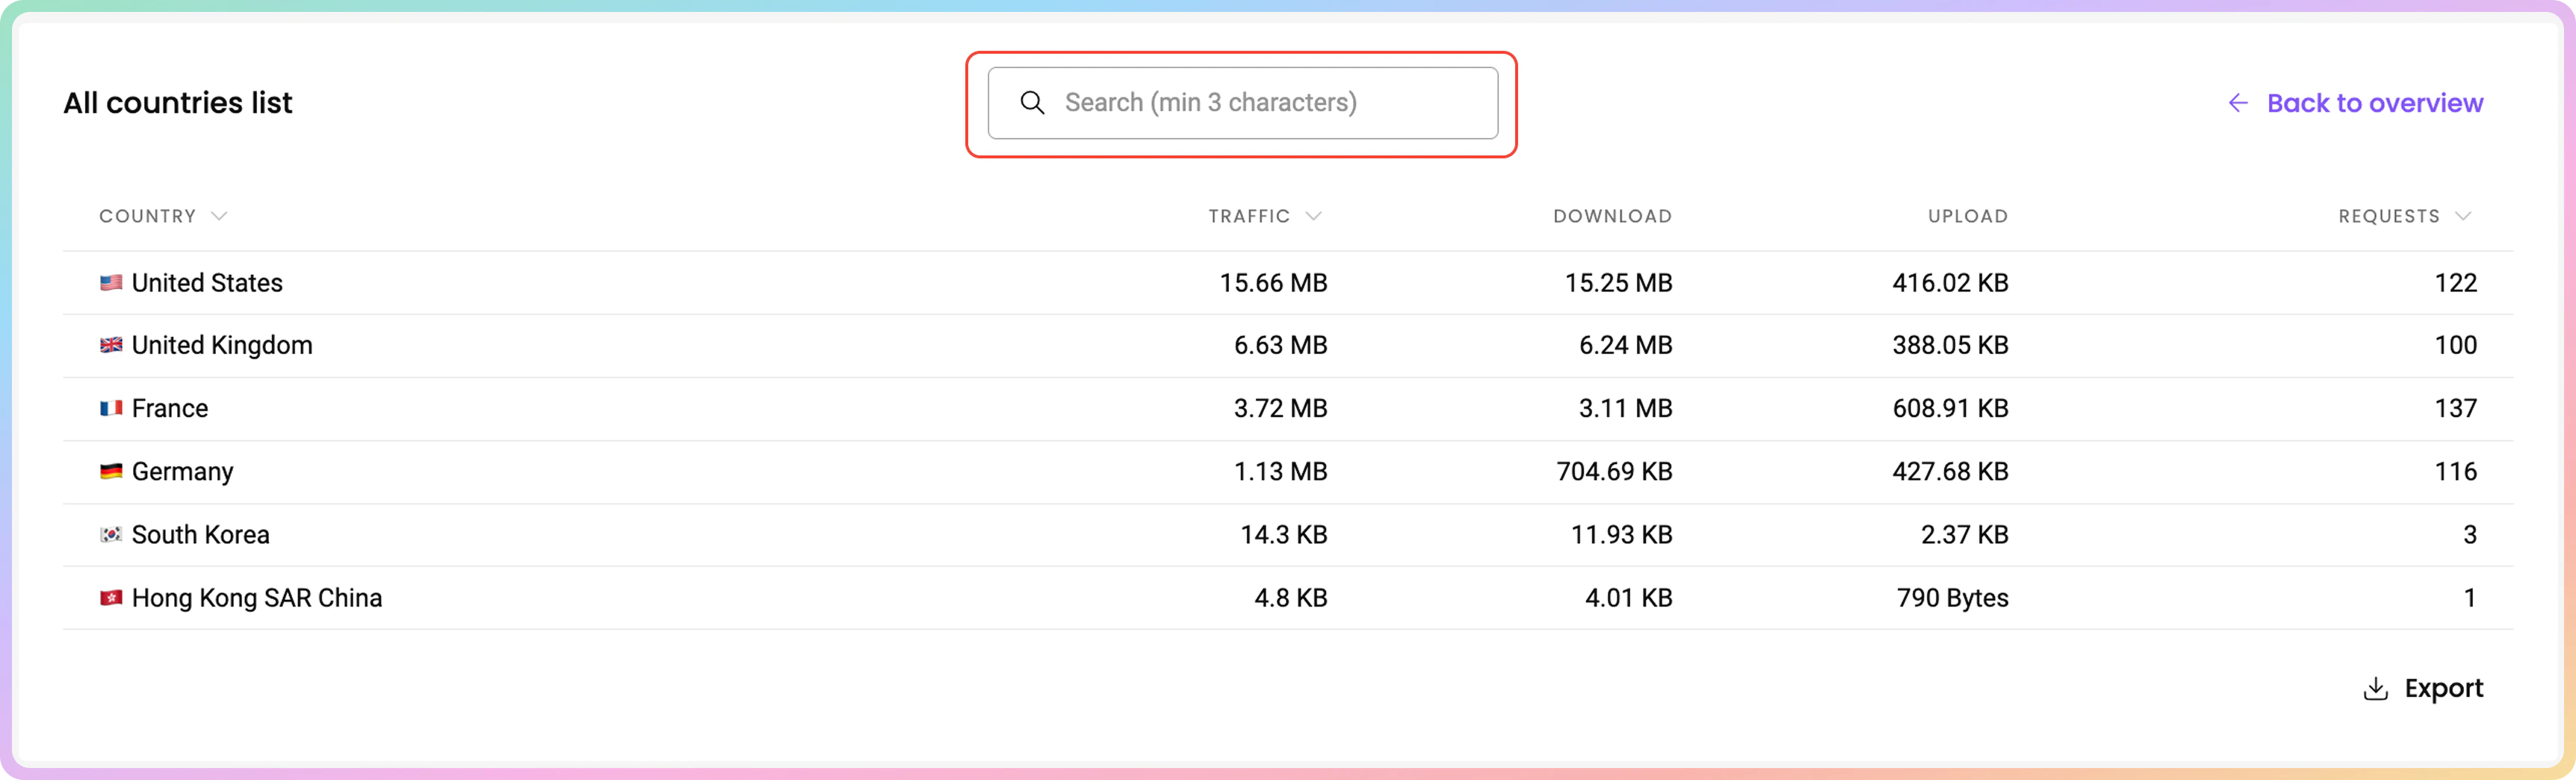
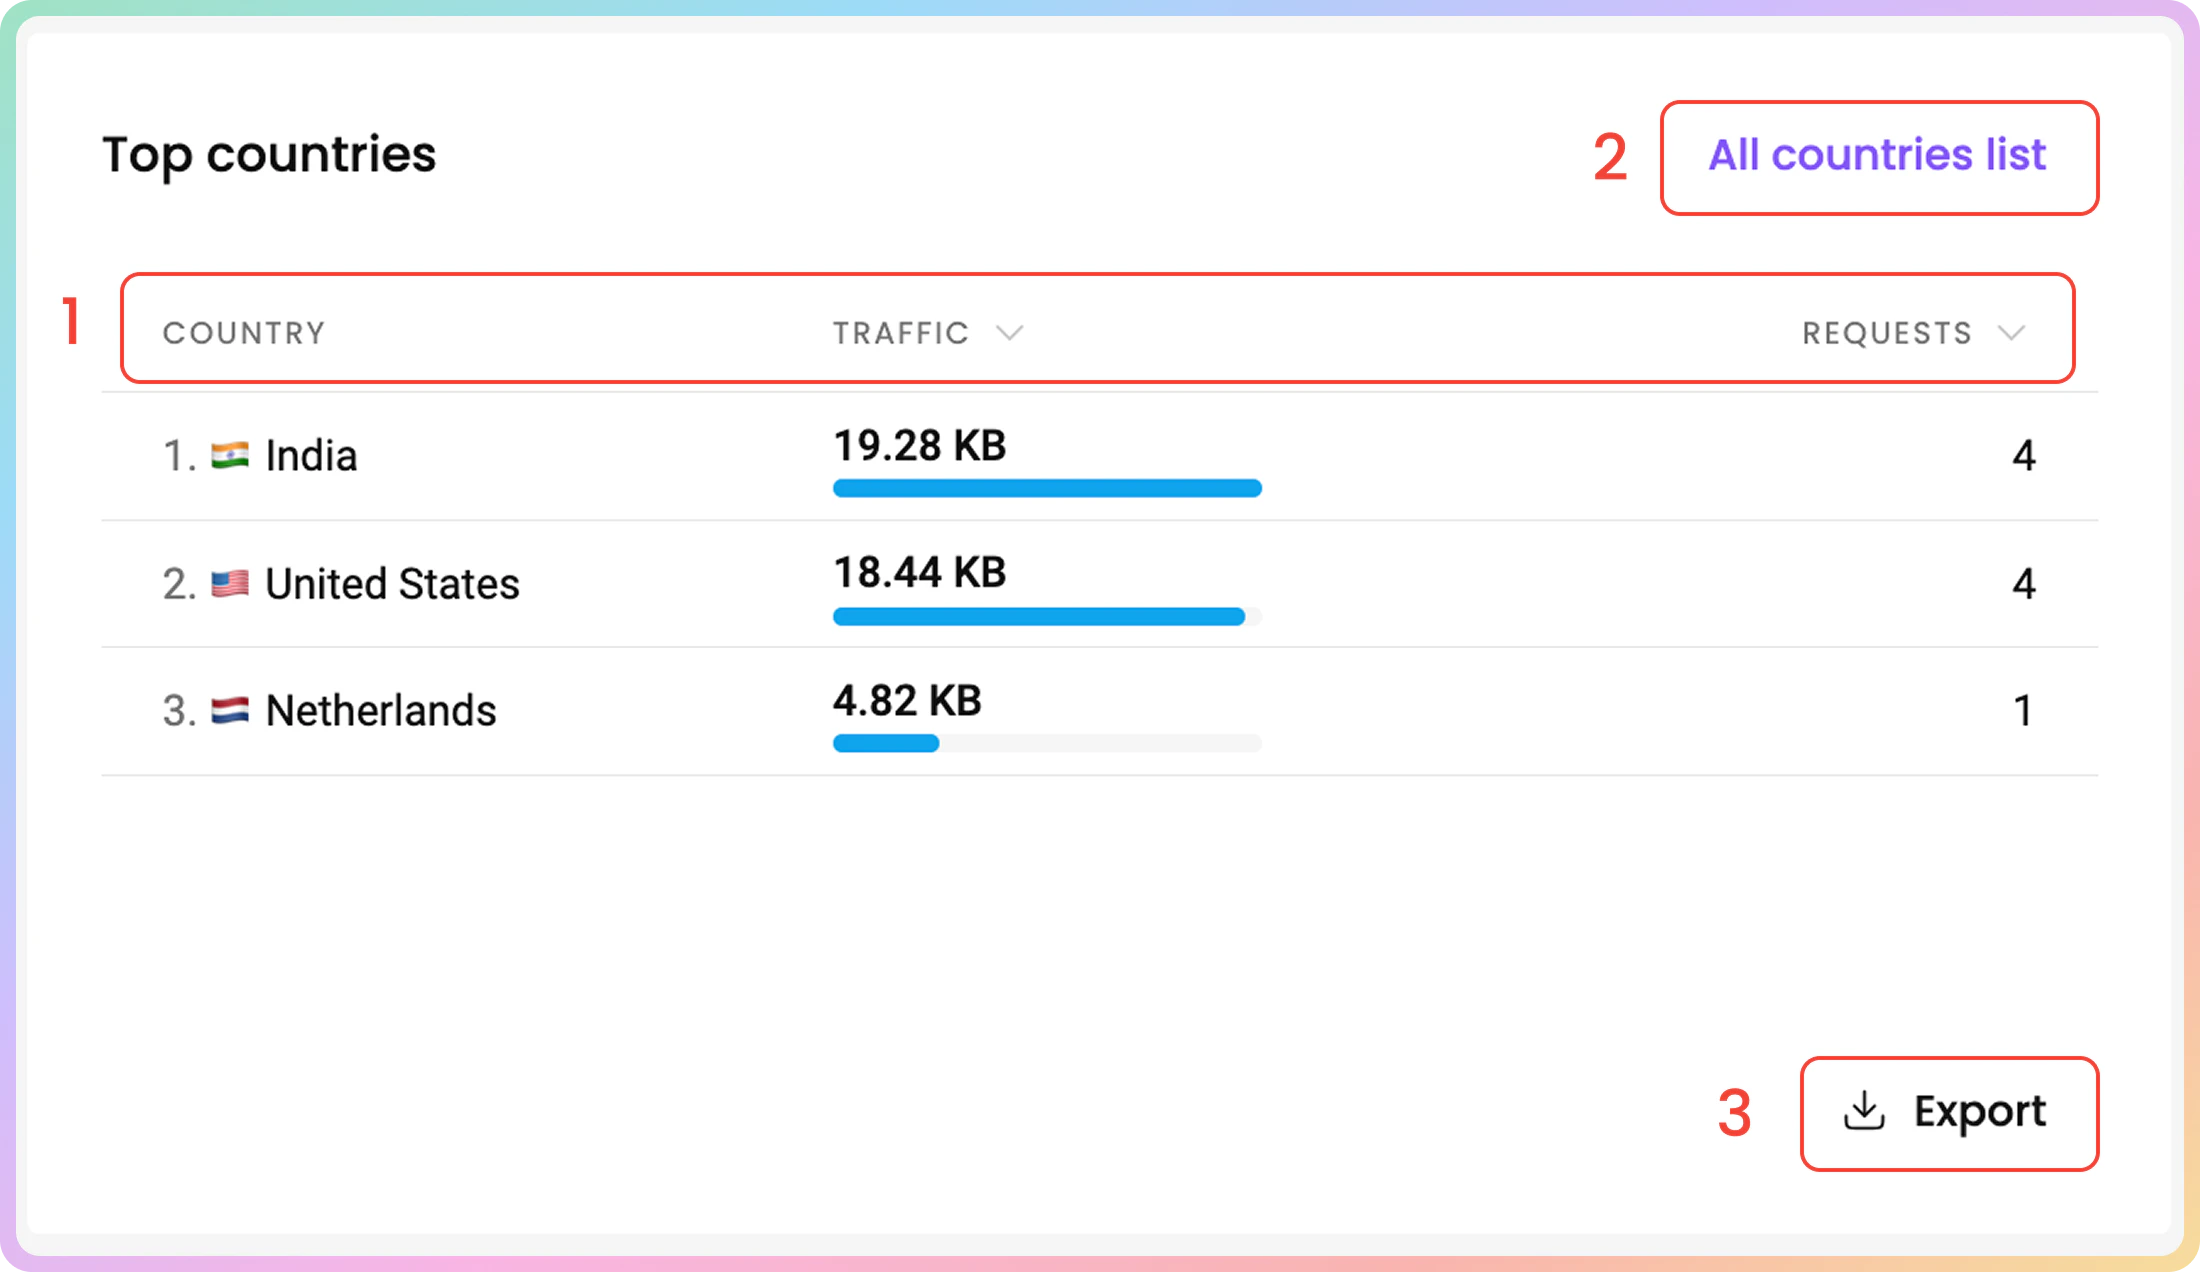
In the **Top countries** table, you can see the countries you have targeted with the proxies, sorted by total traffic consumption in descending order.
1. You can find the **Country**, **Traffic**, and **Requests**.
2. To view the full target list, click on the **All countries list** button located at the top right corner of the table.
* There, you can search the entire list by keywords.
 3. You can export the table's data directly or export the raw data in the following file formats: `.CSV`, .`TXT`, or `.JSON`. You can also copy the data to your clipboard.
 ***
### Top users
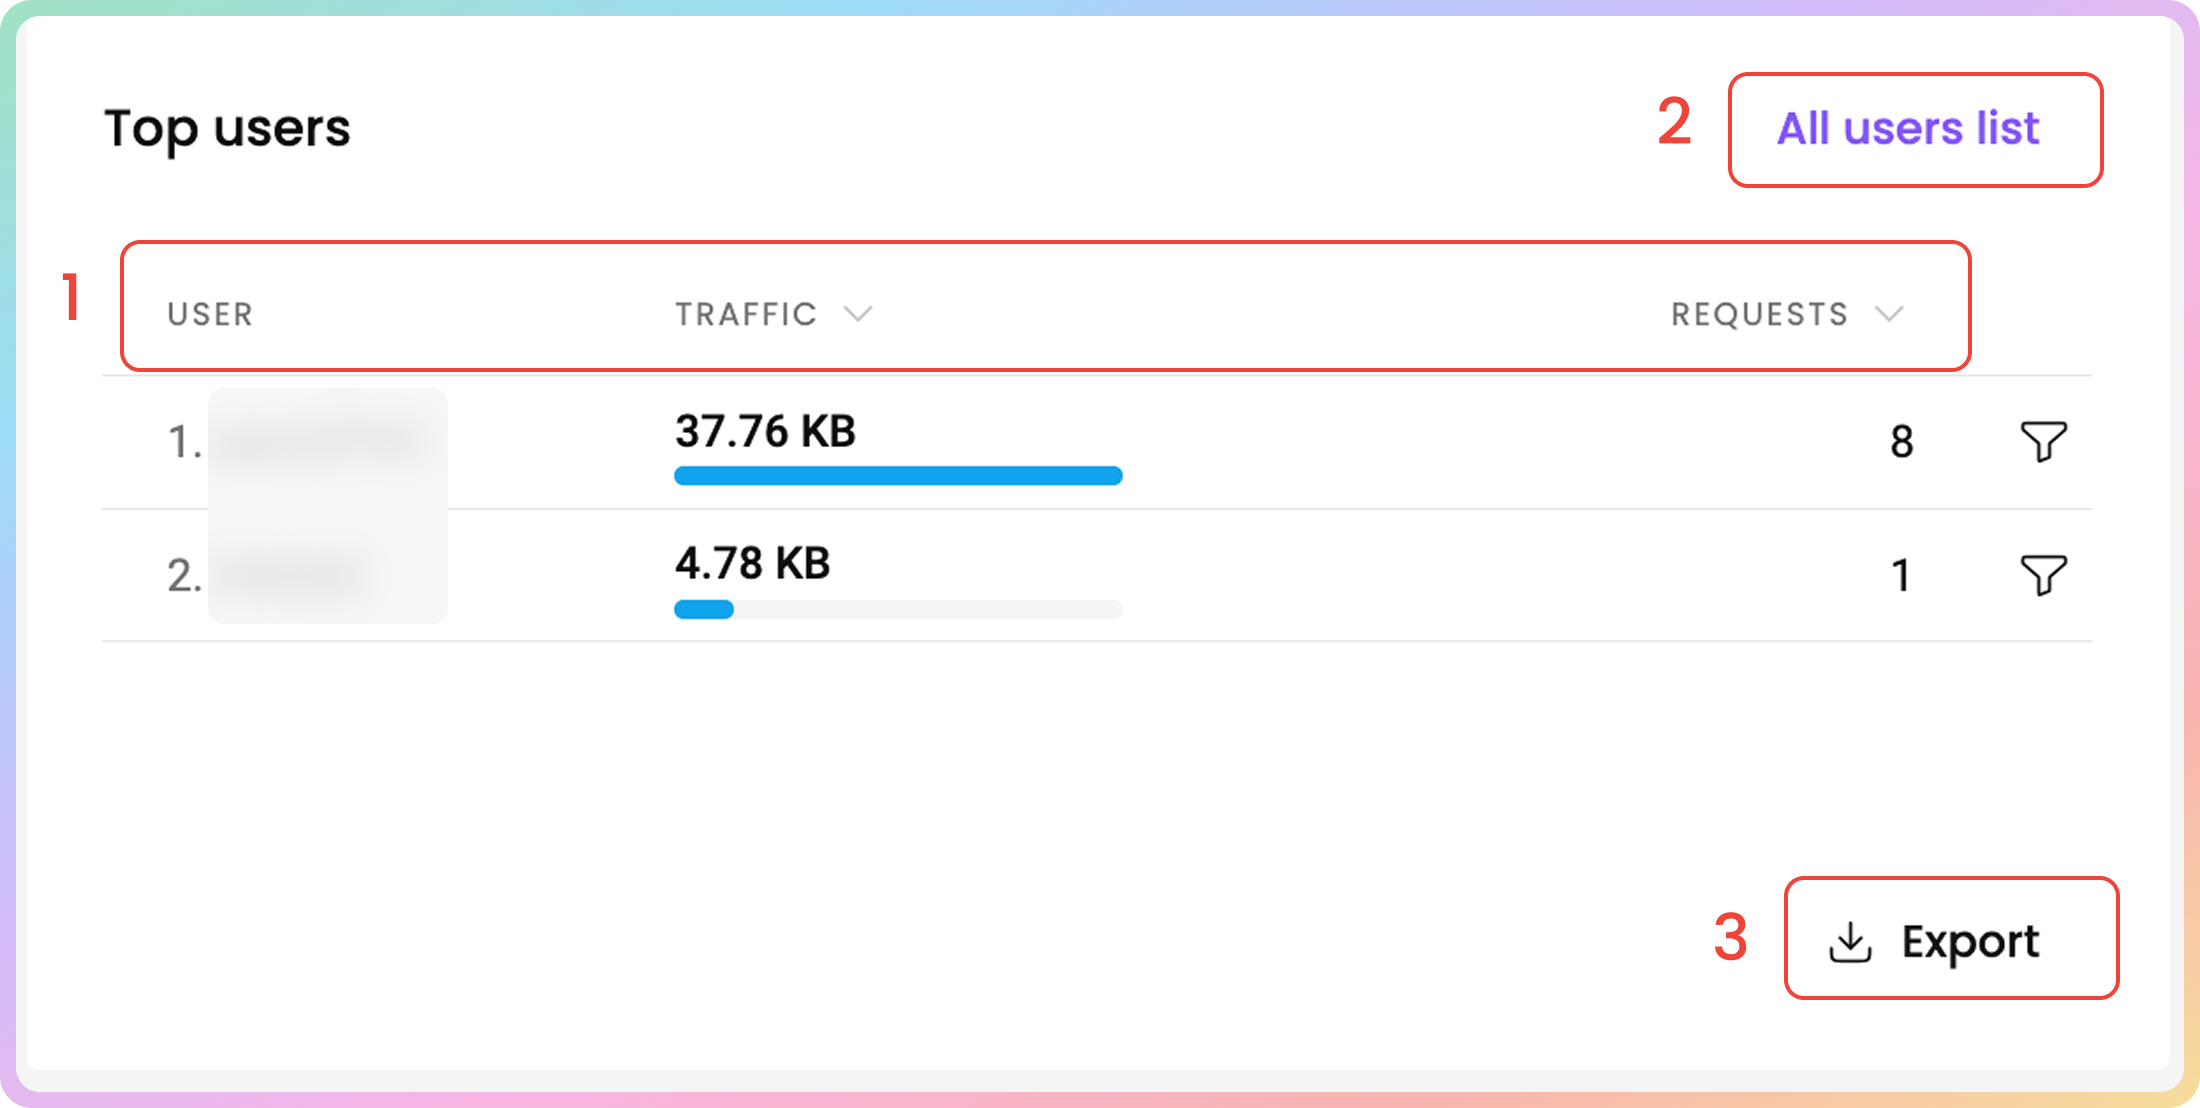
In the **Top users** table, you can see the used traffic of your proxy users and whitelisted IPs, sorted from highest to lowest.
The proxy traffic generated when **authenticating** via the **whitelisted IP** method is **aggregated**. That means sorting used traffic by different whitelisted IPs is not possible.
1. You can find the **User**, **Traffic**, and **Requests** columns as well.
2. To view the full target list, click on the **All users list** button located at the top right corner of the table.
* There, you can search the entire list by keywords.
***
### Top users
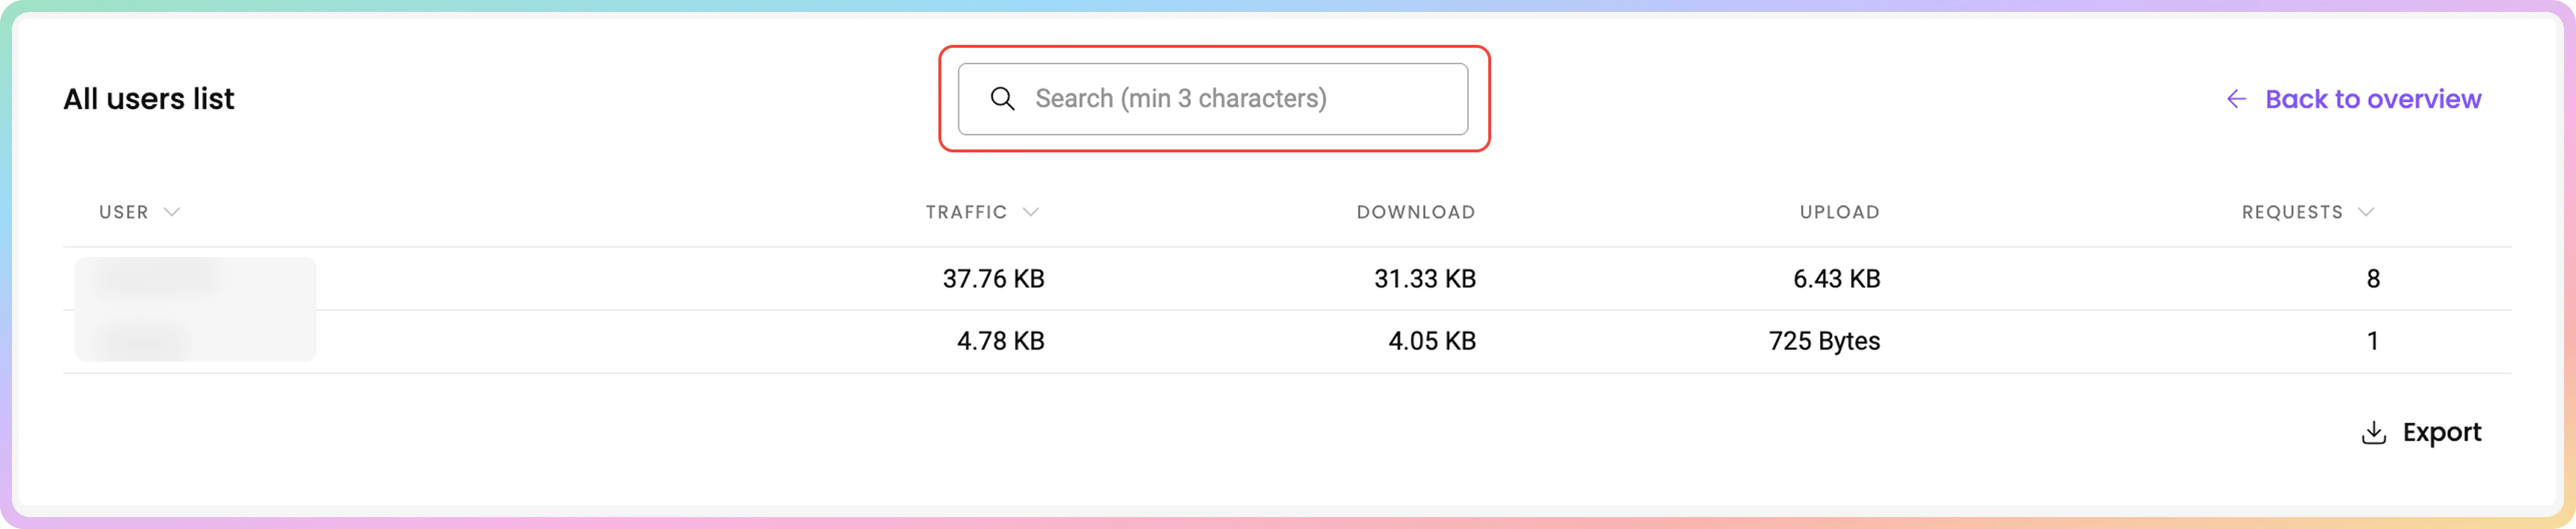
In the **Top users** table, you can see the used traffic of your proxy users and whitelisted IPs, sorted from highest to lowest.
The proxy traffic generated when **authenticating** via the **whitelisted IP** method is **aggregated**. That means sorting used traffic by different whitelisted IPs is not possible.
1. You can find the **User**, **Traffic**, and **Requests** columns as well.
2. To view the full target list, click on the **All users list** button located at the top right corner of the table.
* There, you can search the entire list by keywords.
 3. You can export the table's data directly or export the raw data in the following file formats: `.CSV`, .`TXT`, or `.JSON`. You can also copy the data to your clipboard.
 ***
### Top IPs
In the **Top IPs** table, you can see the proxy IPs you have targeted, sorted by total traffic consumption in descending order.
1. You can find the **No.**, **IP**, **Traffic** and **Requests** columns.
2. To view the full IP list, click on the **All IPs list** button located at the top right corner of the table.
* There, you can search the entire list by keywords.
***
### Top IPs
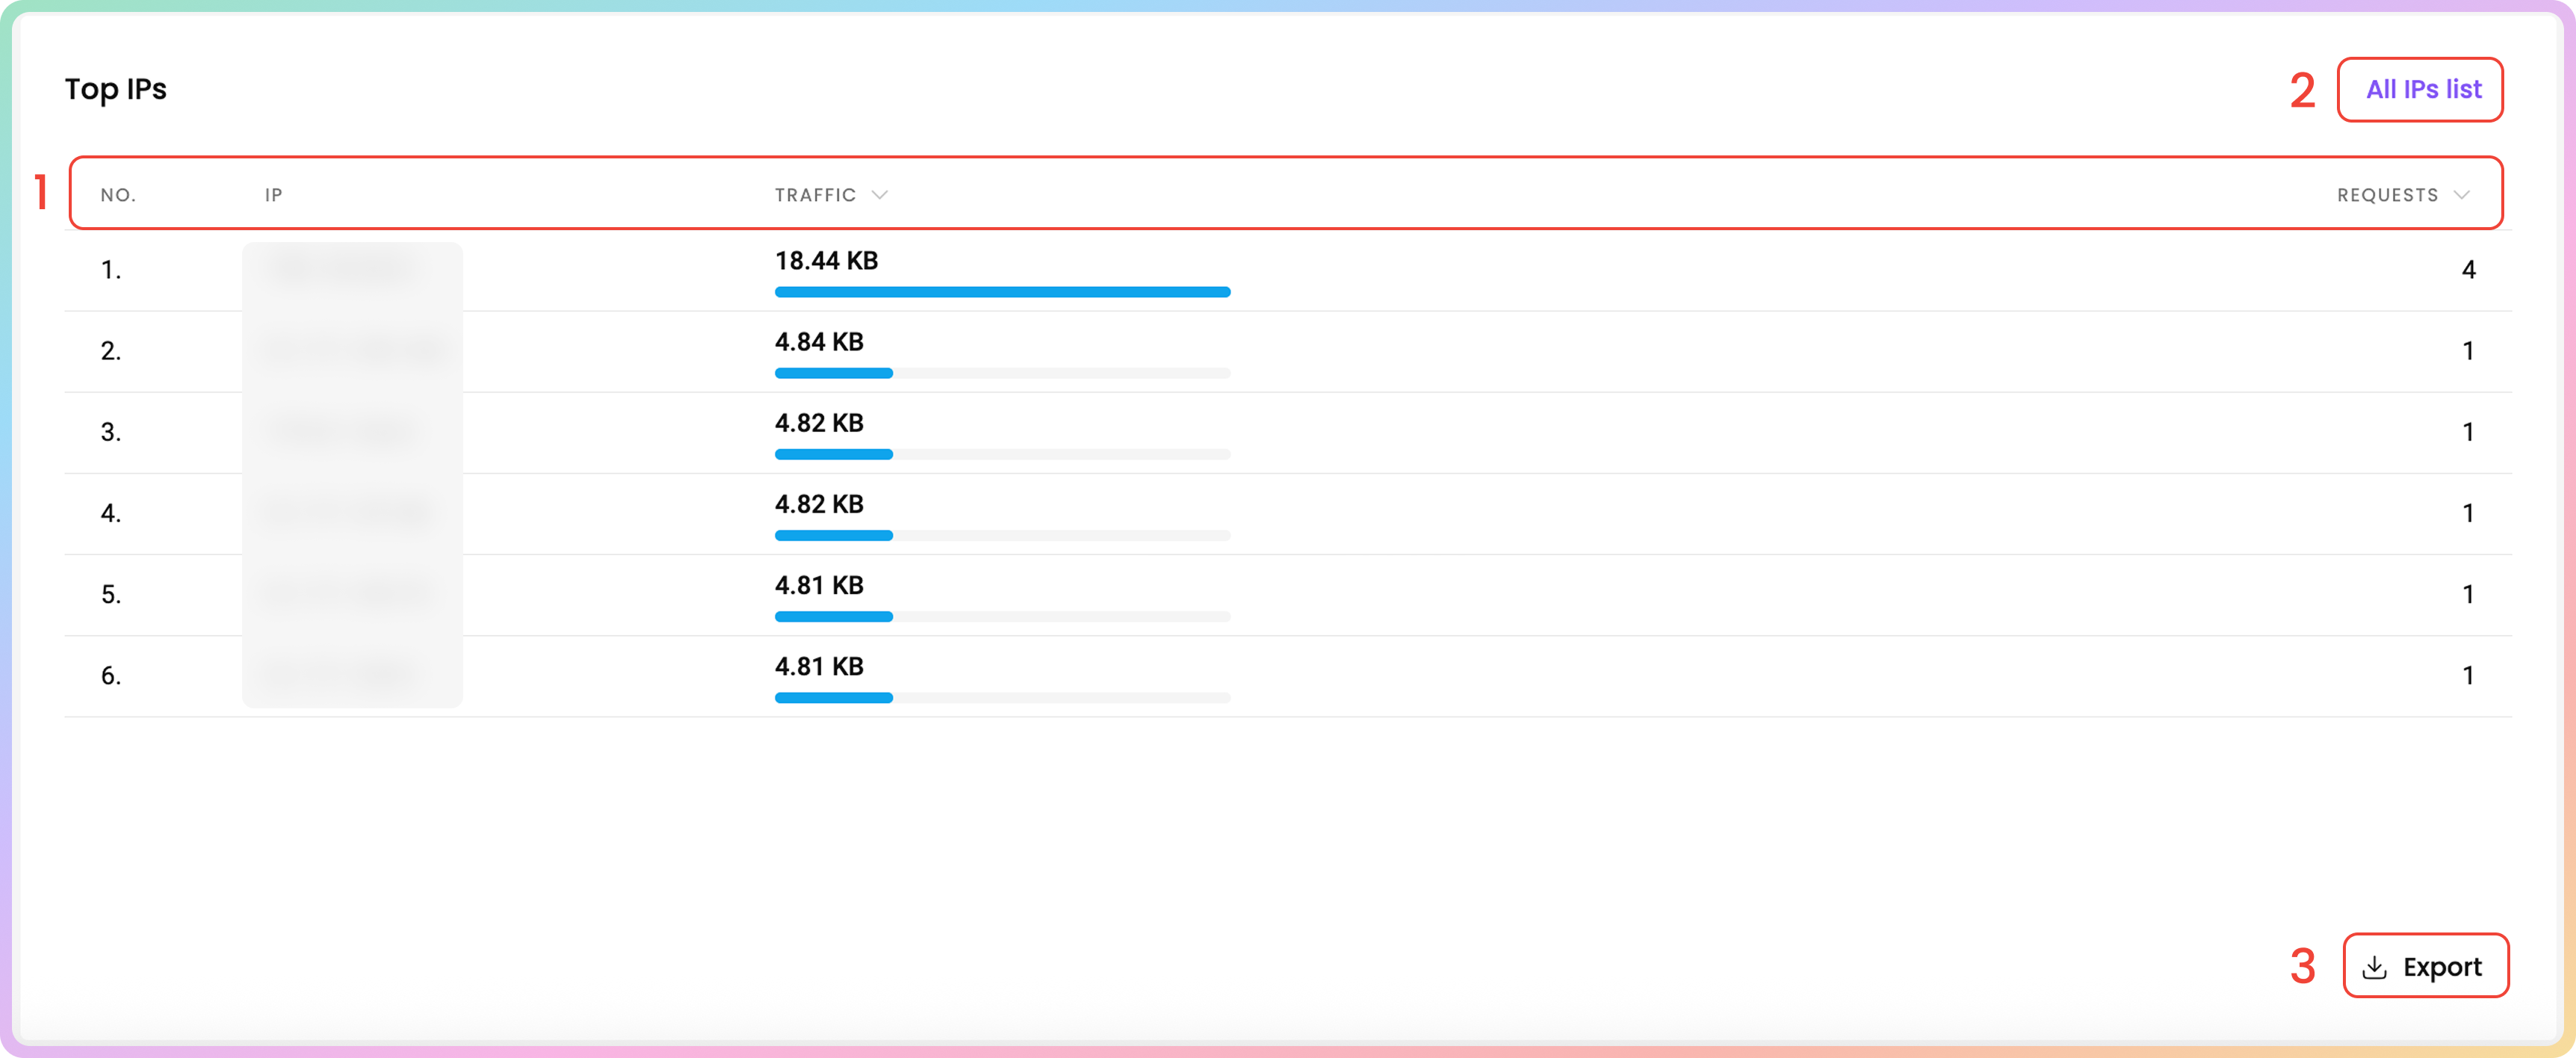
In the **Top IPs** table, you can see the proxy IPs you have targeted, sorted by total traffic consumption in descending order.
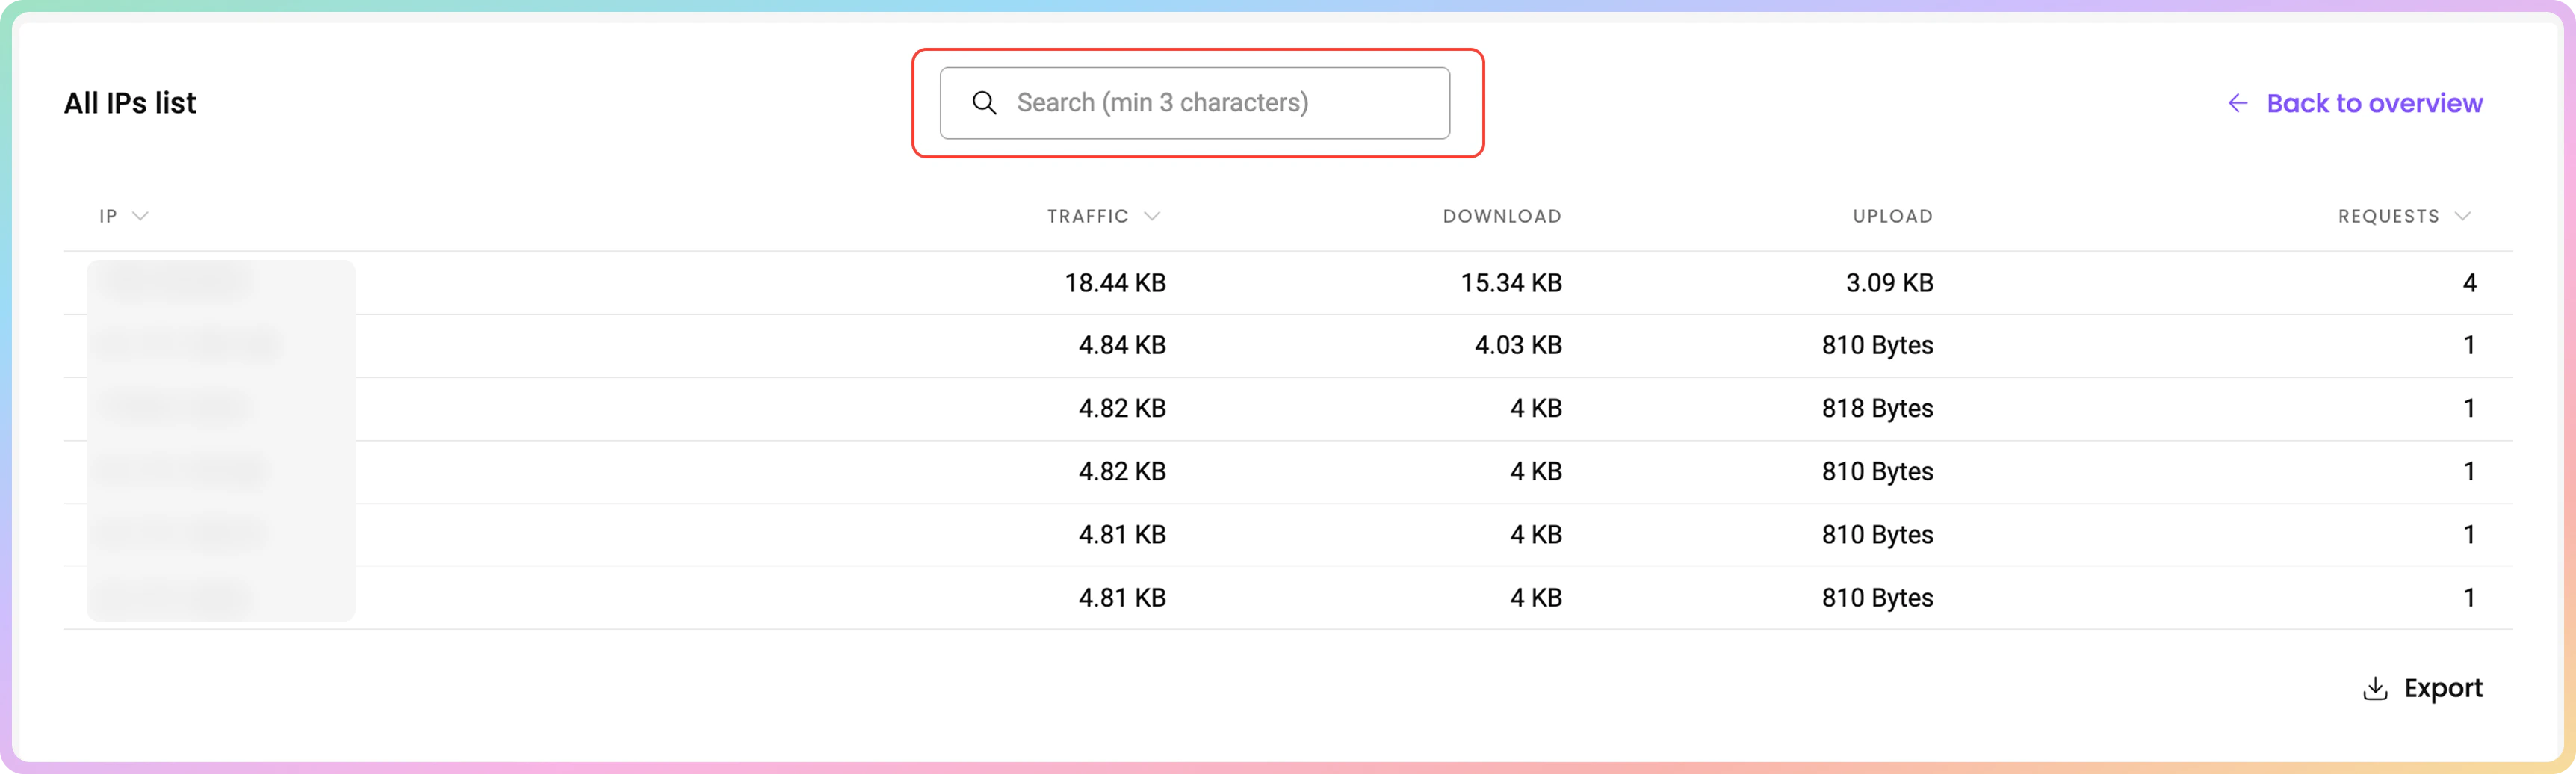
1. You can find the **No.**, **IP**, **Traffic** and **Requests** columns.
2. To view the full IP list, click on the **All IPs list** button located at the top right corner of the table.
* There, you can search the entire list by keywords.
 3. You can export the table's data directly or export the raw data in the following file formats: `.CSV`, .`TXT`, or `.JSON`. You can also copy the data to your clipboard.
 ***
## Unrecognized Usage in Statistics
### Unfamiliar Target Websites
If you see an unfamiliar target on your statistics page, keep in mind that it may be a **subdomain** of the websites you are targeting. This means the target website uses subdomains to organize separate sections of content or services. The dashboard **tracks** these **subdomains** as well.
### Unexpected Traffic Consumption
* If you notice a higher traffic usage with the proxies, note that the traffic may have been consumed by **applications** running and updating in the **background** while you're using the proxies.
* Additionally, **target** **websites** could have **changed** and introduced new **content**, which would impact the proxy traffic.
* Generally, it's advised to generate a new **password** for your **proxy users periodically**.
* Don't forget to **turn off** the **tool** or **program** you are using to run the proxies after you're done using them.
Look at [**High traffic usage**](https://help.decodo.com/docs/high-traffic-usage) for a more detailed understanding of traffic discrepancies.
***
Need help or just want to say hello? Our support is available 24/7. \
You can also reach us anytime via email at [support@decodo.com](mailto:support@decodo.com).
Can't find what you're looking for? Request an article! \
Have feedback? Share your thoughts on how we can improve.
***
## Unrecognized Usage in Statistics
### Unfamiliar Target Websites
If you see an unfamiliar target on your statistics page, keep in mind that it may be a **subdomain** of the websites you are targeting. This means the target website uses subdomains to organize separate sections of content or services. The dashboard **tracks** these **subdomains** as well.
### Unexpected Traffic Consumption
* If you notice a higher traffic usage with the proxies, note that the traffic may have been consumed by **applications** running and updating in the **background** while you're using the proxies.
* Additionally, **target** **websites** could have **changed** and introduced new **content**, which would impact the proxy traffic.
* Generally, it's advised to generate a new **password** for your **proxy users periodically**.
* Don't forget to **turn off** the **tool** or **program** you are using to run the proxies after you're done using them.
Look at [**High traffic usage**](https://help.decodo.com/docs/high-traffic-usage) for a more detailed understanding of traffic discrepancies.
***
Need help or just want to say hello? Our support is available 24/7. \
You can also reach us anytime via email at [support@decodo.com](mailto:support@decodo.com).
Can't find what you're looking for? Request an article! \
Have feedback? Share your thoughts on how we can improve.