> ## Documentation Index
> Fetch the complete documentation index at: https://help.decodo.com/llms.txt
> Use this file to discover all available pages before exploring further.
# Usage Statistics
> Residential Proxy Traffic Usage Statistics
Residential proxy traffic usage details can be found on your dashboard statistics page. Simply navigate to the Residential proxy page via the dashboard left panel and click on the [**Usage statistics**](https://dashboard.decodo.com/residential-proxies/statistics?) section.
If you're interested in learning how traffic is counted, head over to [**Traffic usage**](https://help.decodo.com/docs/proxy-traffic).
***
## Statistics data line graph
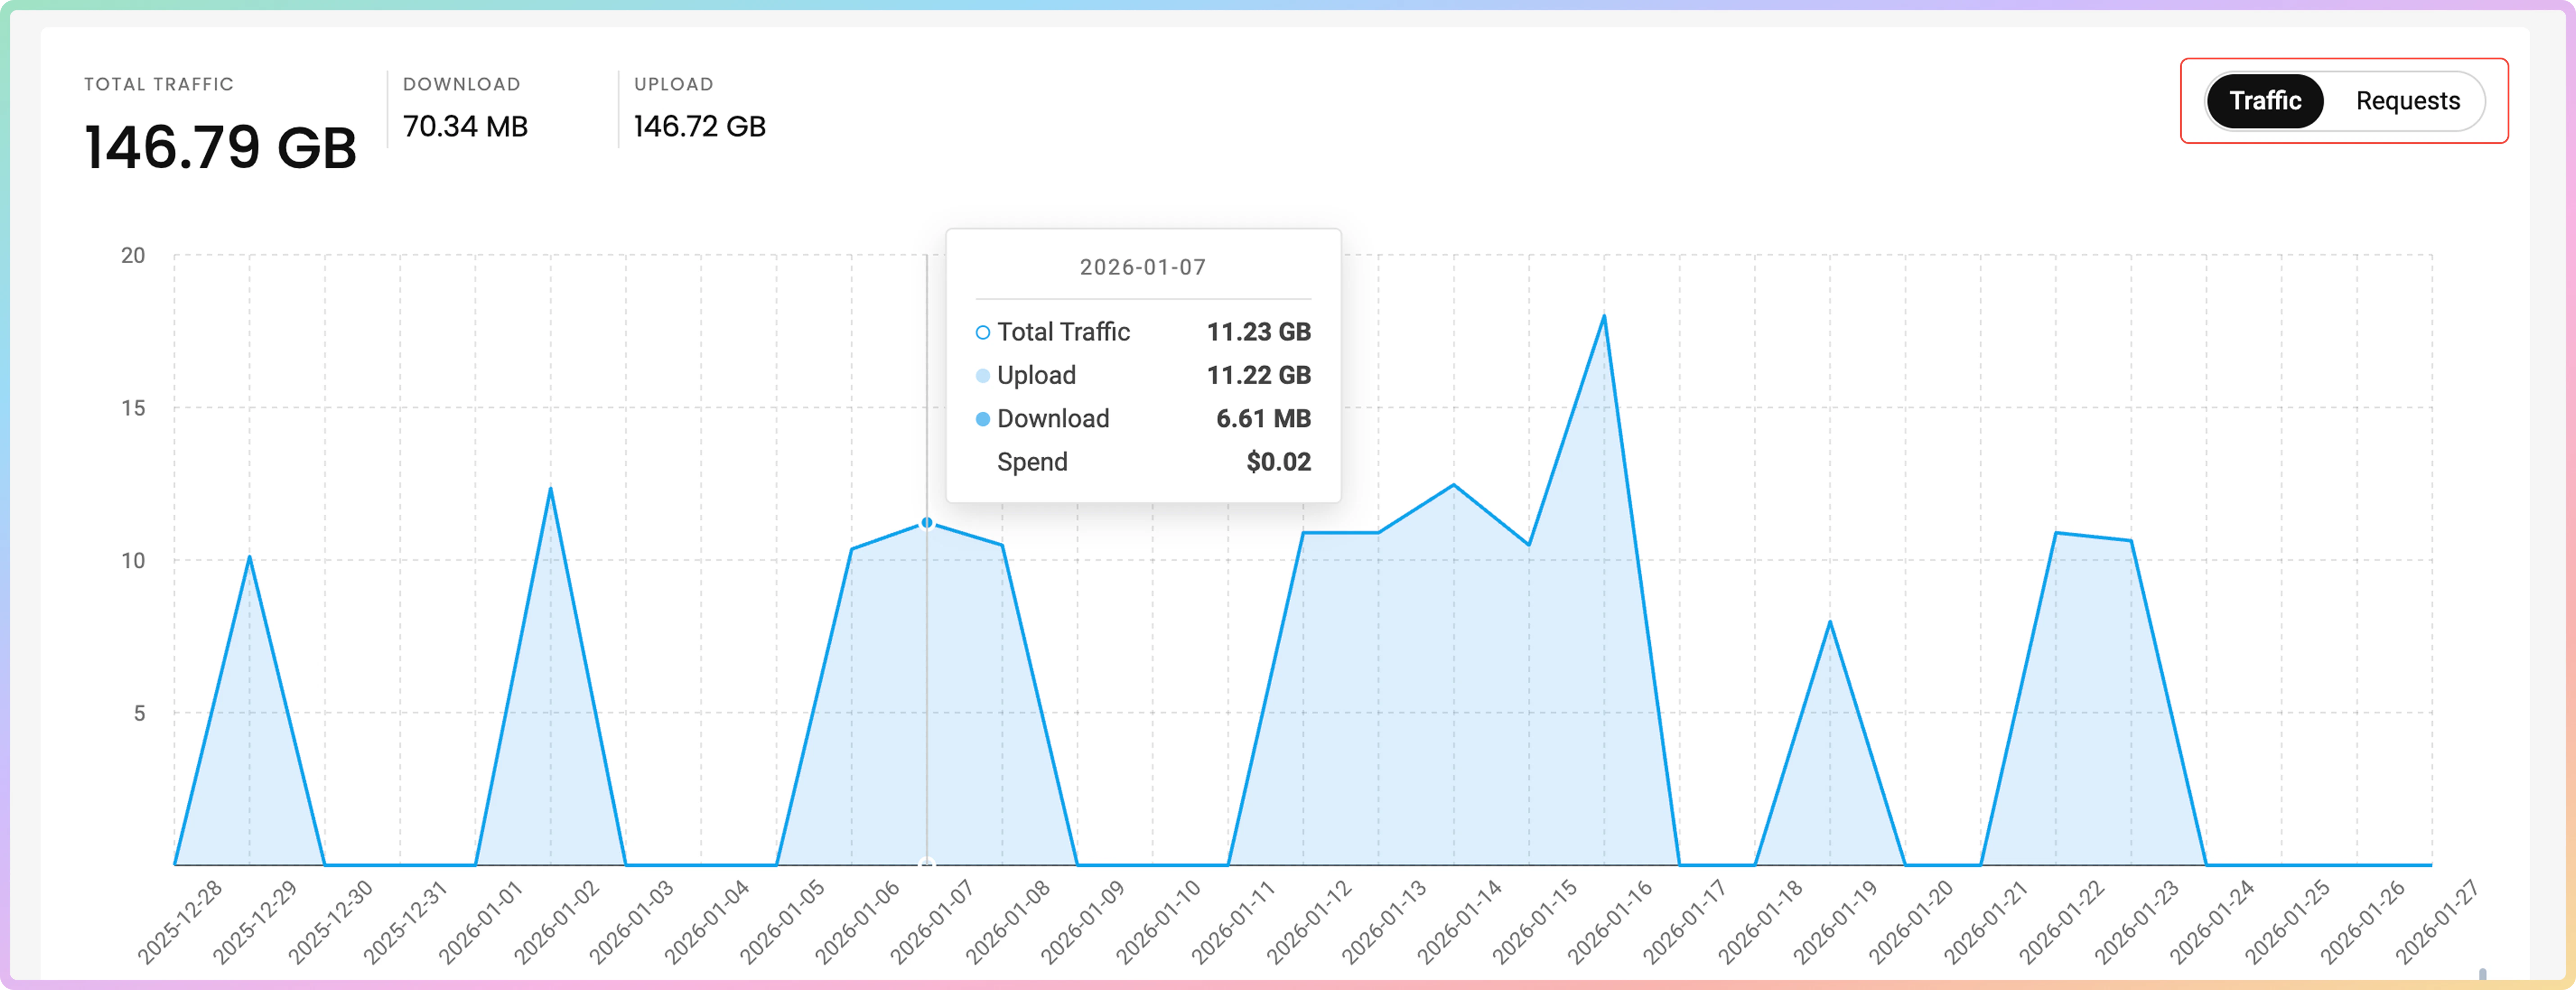
You will see a line graph, which displays your total **Traffic** or **Requests** sent with the proxies.
Usage data is updated every 10 to 15 minutes. Statistics are provided in the UTC time zone.
* In the **Traffic** line graph, the vertical axis shows the used traffic in `MB` and/or `GB`, whereas the horizontal axis shows the time you grouped by.
* You can hover over the data points in the line graph to see detailed usage for the selected time.
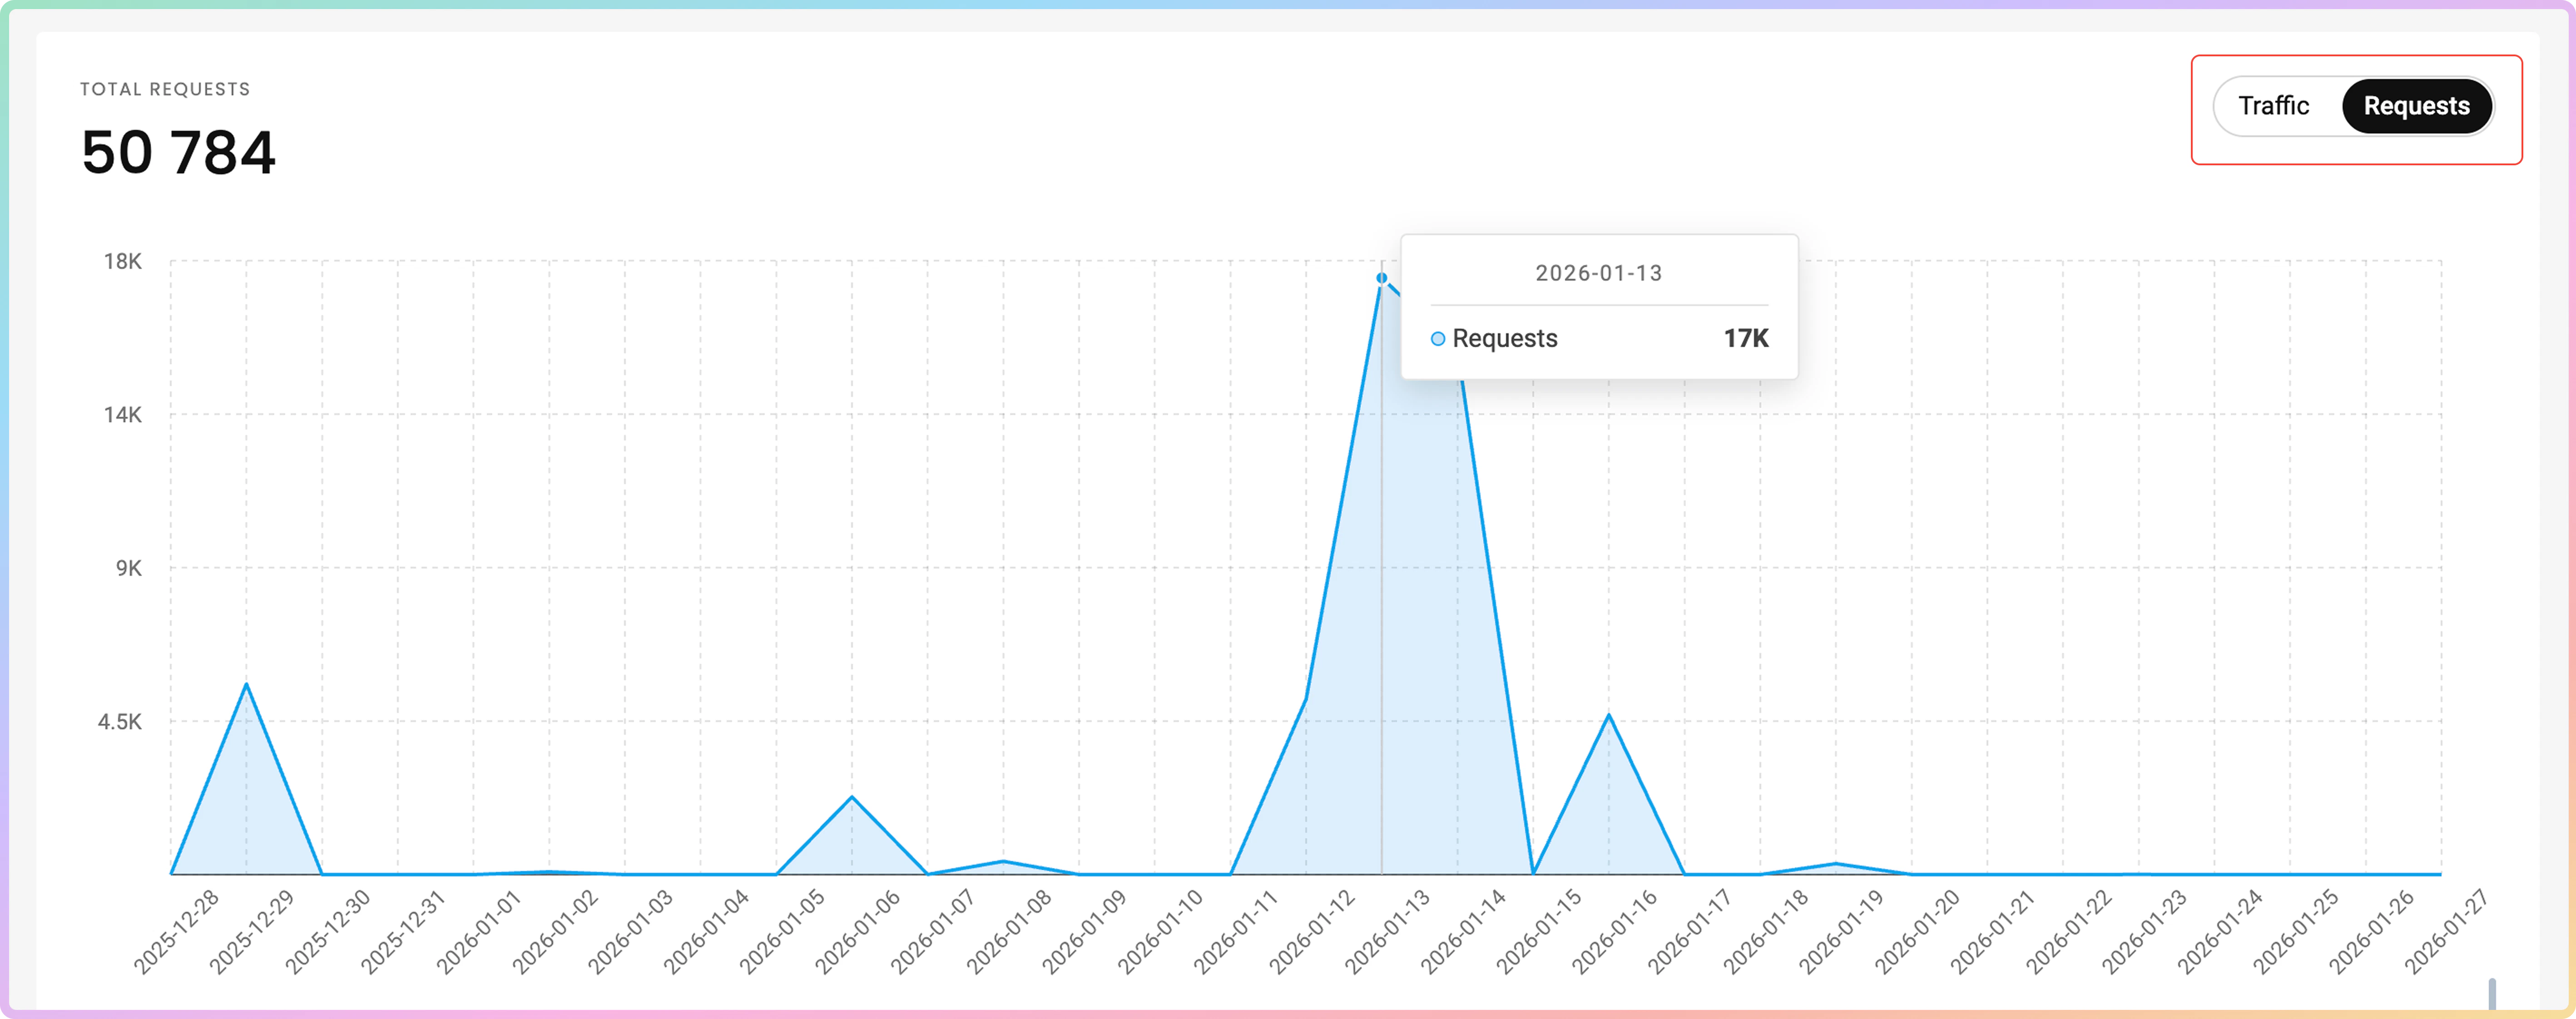
 * In the **Requests** line graph, the vertical axis shows the count of requests sent with the proxies, whereas the horizontal axis shows the time you grouped by.
* You can hover over the data points in the line graph to see detailed usage for the selected time.
* In the **Requests** line graph, the vertical axis shows the count of requests sent with the proxies, whereas the horizontal axis shows the time you grouped by.
* You can hover over the data points in the line graph to see detailed usage for the selected time.
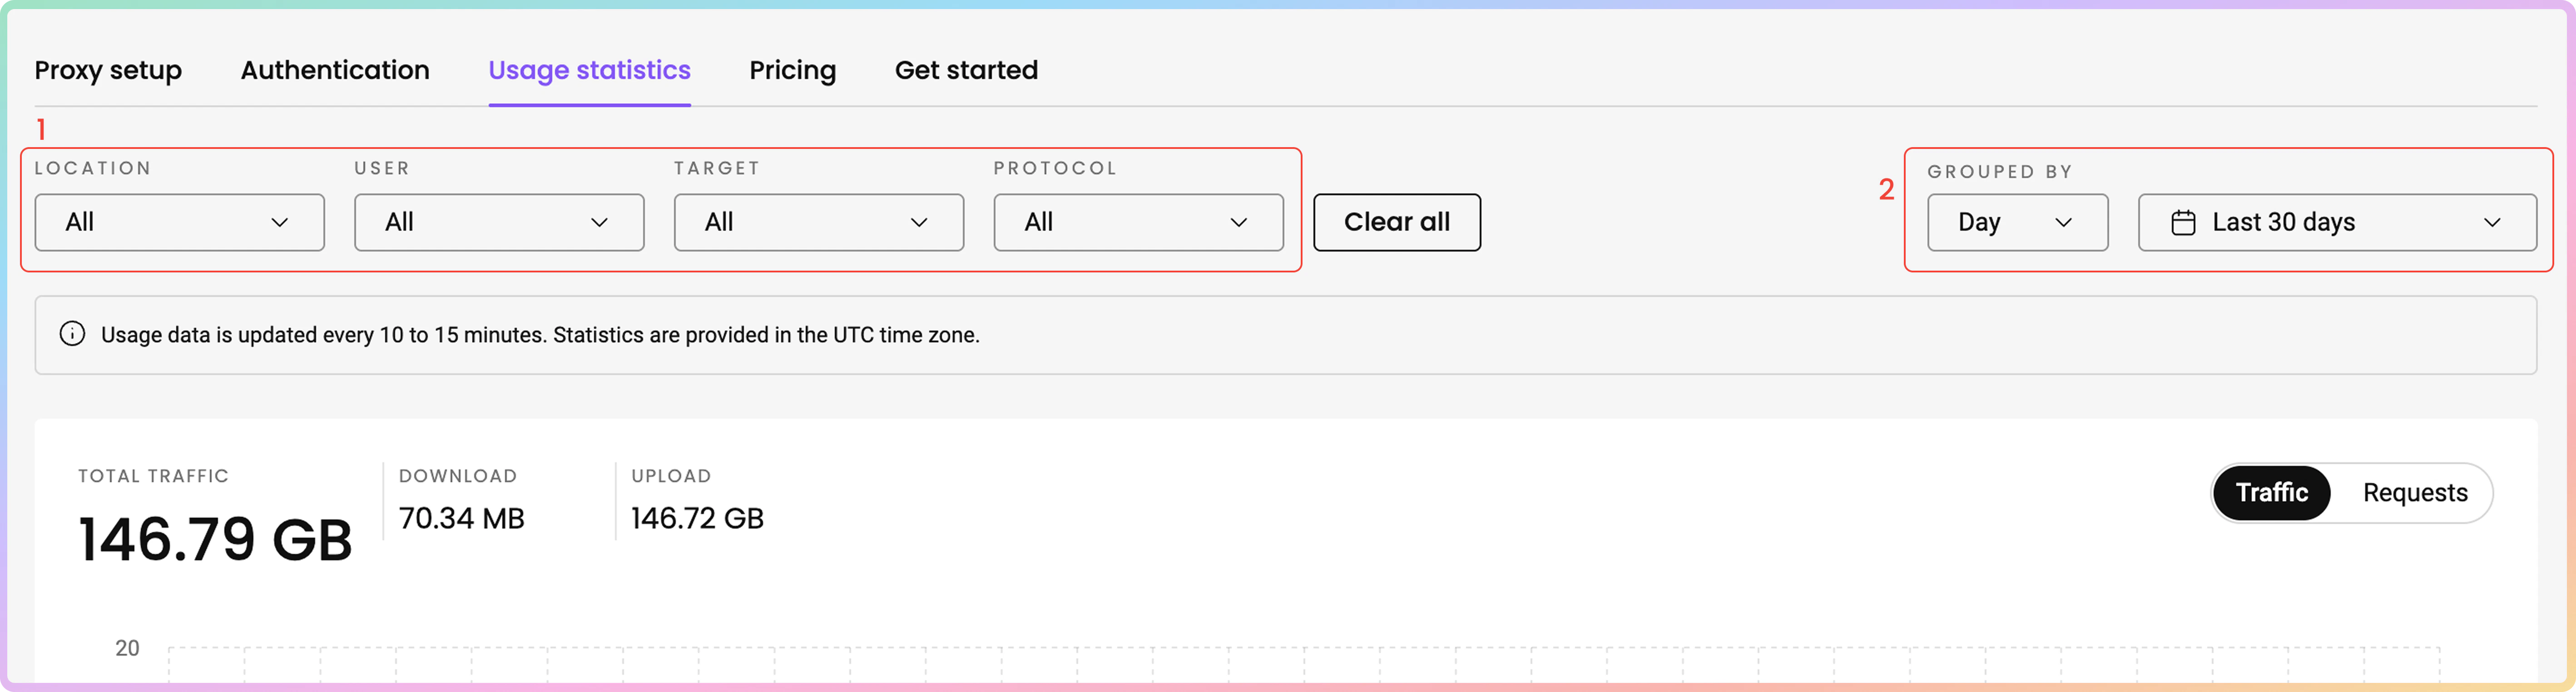
 1. You can choose to sort the data by **Location**, Proxy **User**, **Target**, or **Protocol**.
2. You can also group the data by **hour**, **day**, **week**, or **month**.
Traffic history is limited to a maximum of 180 days.
1. You can choose to sort the data by **Location**, Proxy **User**, **Target**, or **Protocol**.
2. You can also group the data by **hour**, **day**, **week**, or **month**.
Traffic history is limited to a maximum of 180 days.
 ***
## Statistics data table
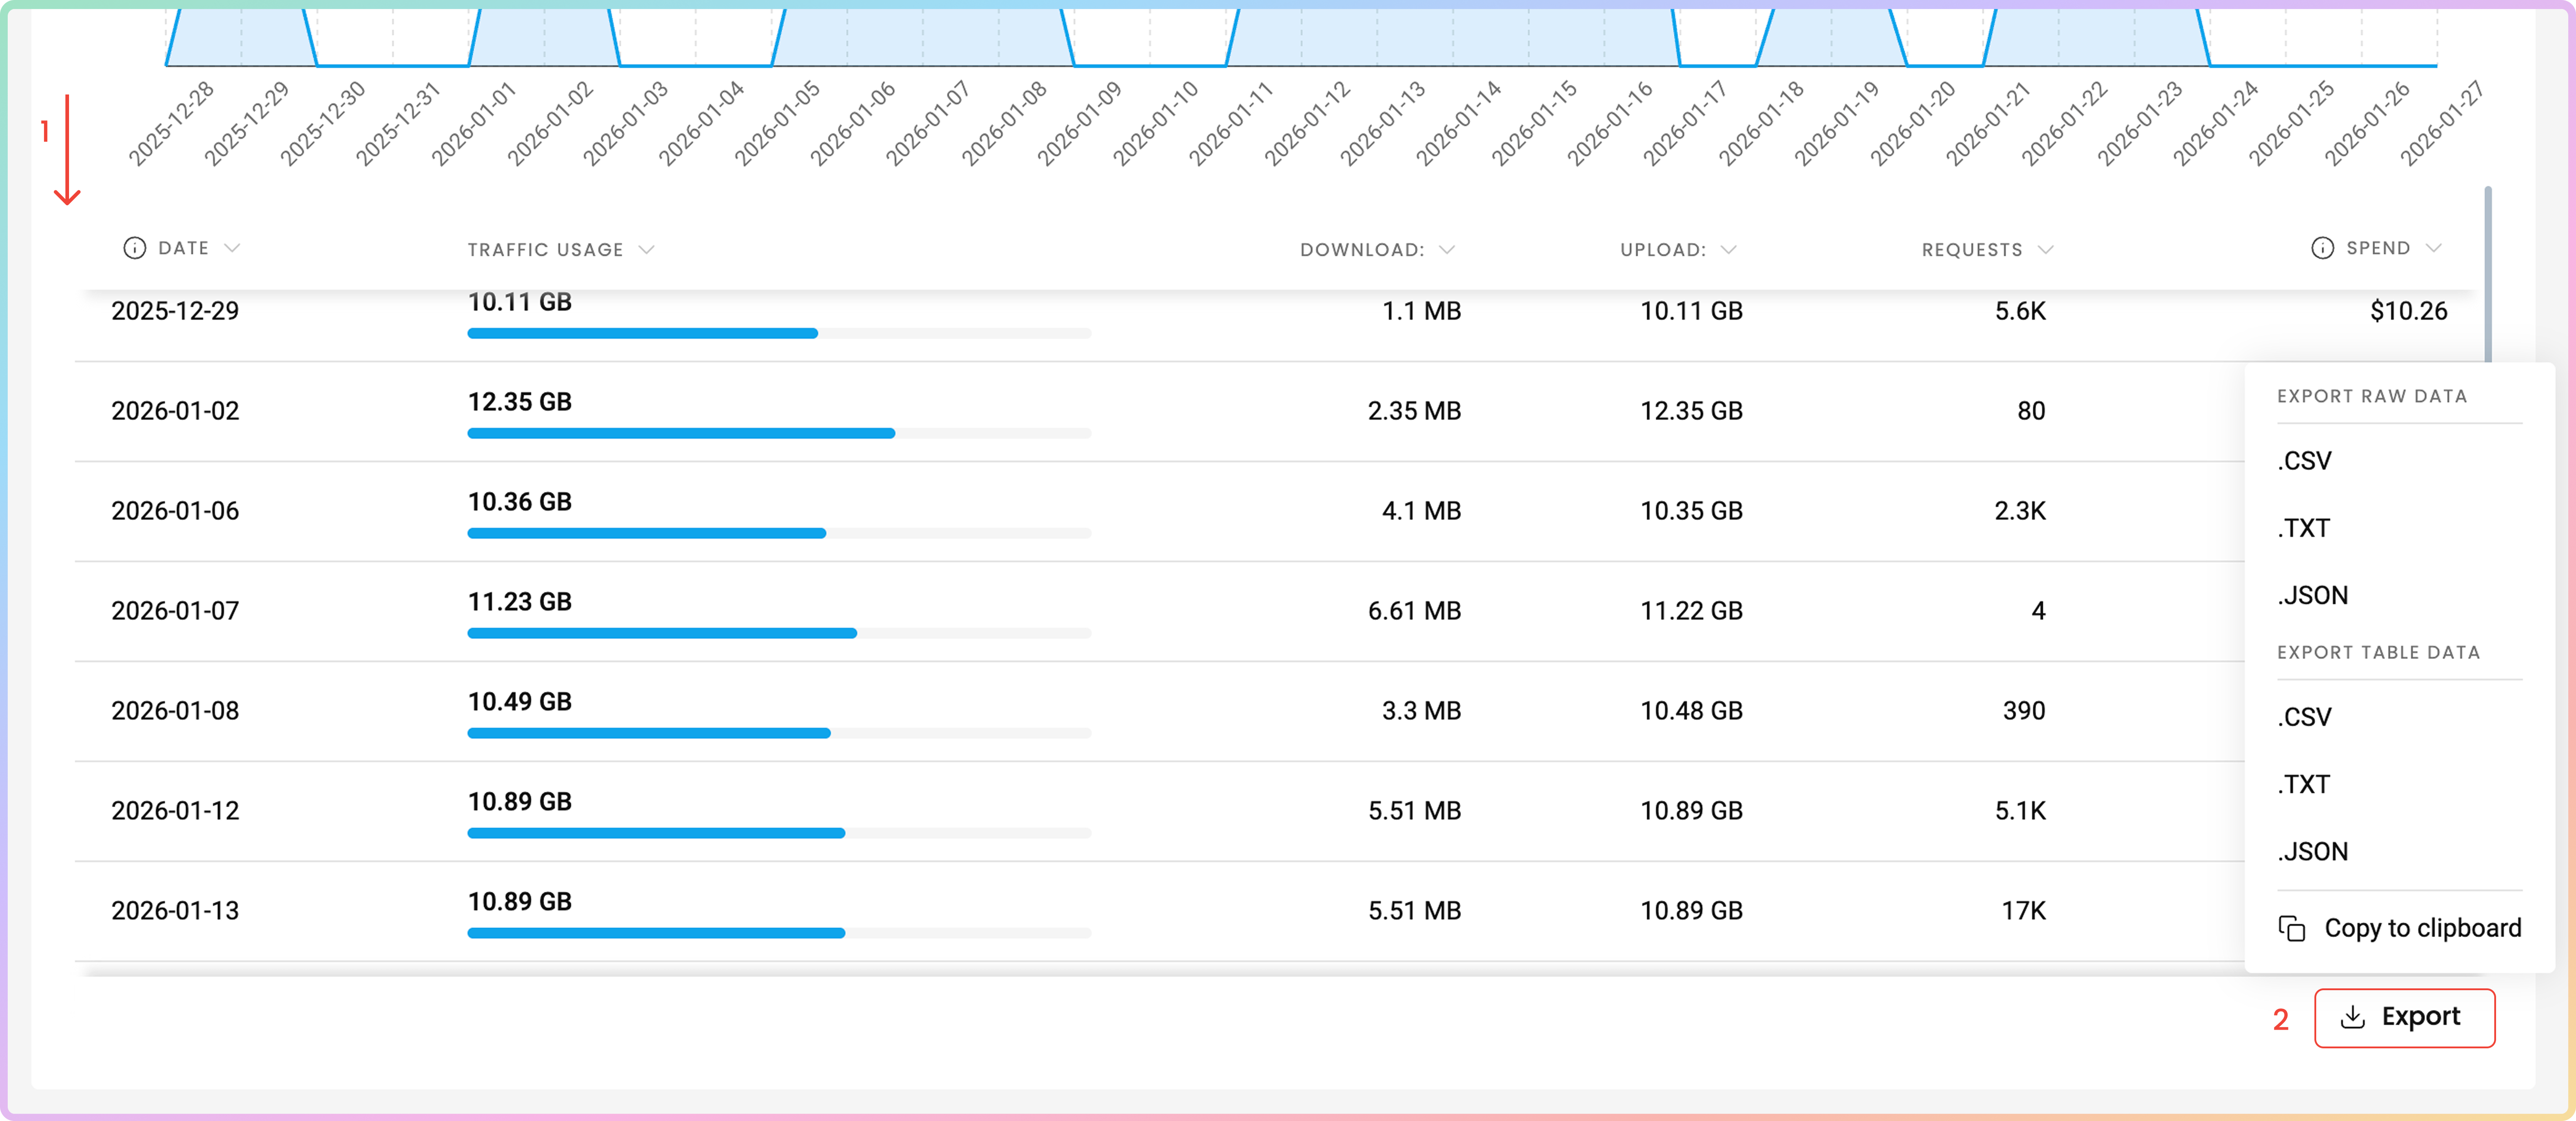
Below the line graph, you can view the data table that summarizes the traffic used with the proxies.
1. You can find the **Date**, **Traffic Usage**, **Download**, and **Upload** traffic in `MB` or `GB`. The next two columns describe the number of **Requests** and **Spend**. **Spend** is the cost in USD that's equivalent to the traffic used.
2. You can export the table's data directly or export the raw data in the following file formats: `.CSV`,.`TXT`, or `.JSON`. You can also copy the data to your clipboard.
***
## Statistics data table
Below the line graph, you can view the data table that summarizes the traffic used with the proxies.
1. You can find the **Date**, **Traffic Usage**, **Download**, and **Upload** traffic in `MB` or `GB`. The next two columns describe the number of **Requests** and **Spend**. **Spend** is the cost in USD that's equivalent to the traffic used.
2. You can export the table's data directly or export the raw data in the following file formats: `.CSV`,.`TXT`, or `.JSON`. You can also copy the data to your clipboard.
 Below are three additional data tables: **Top targets**, **Top countries**, and **Top users**.
### Top targets
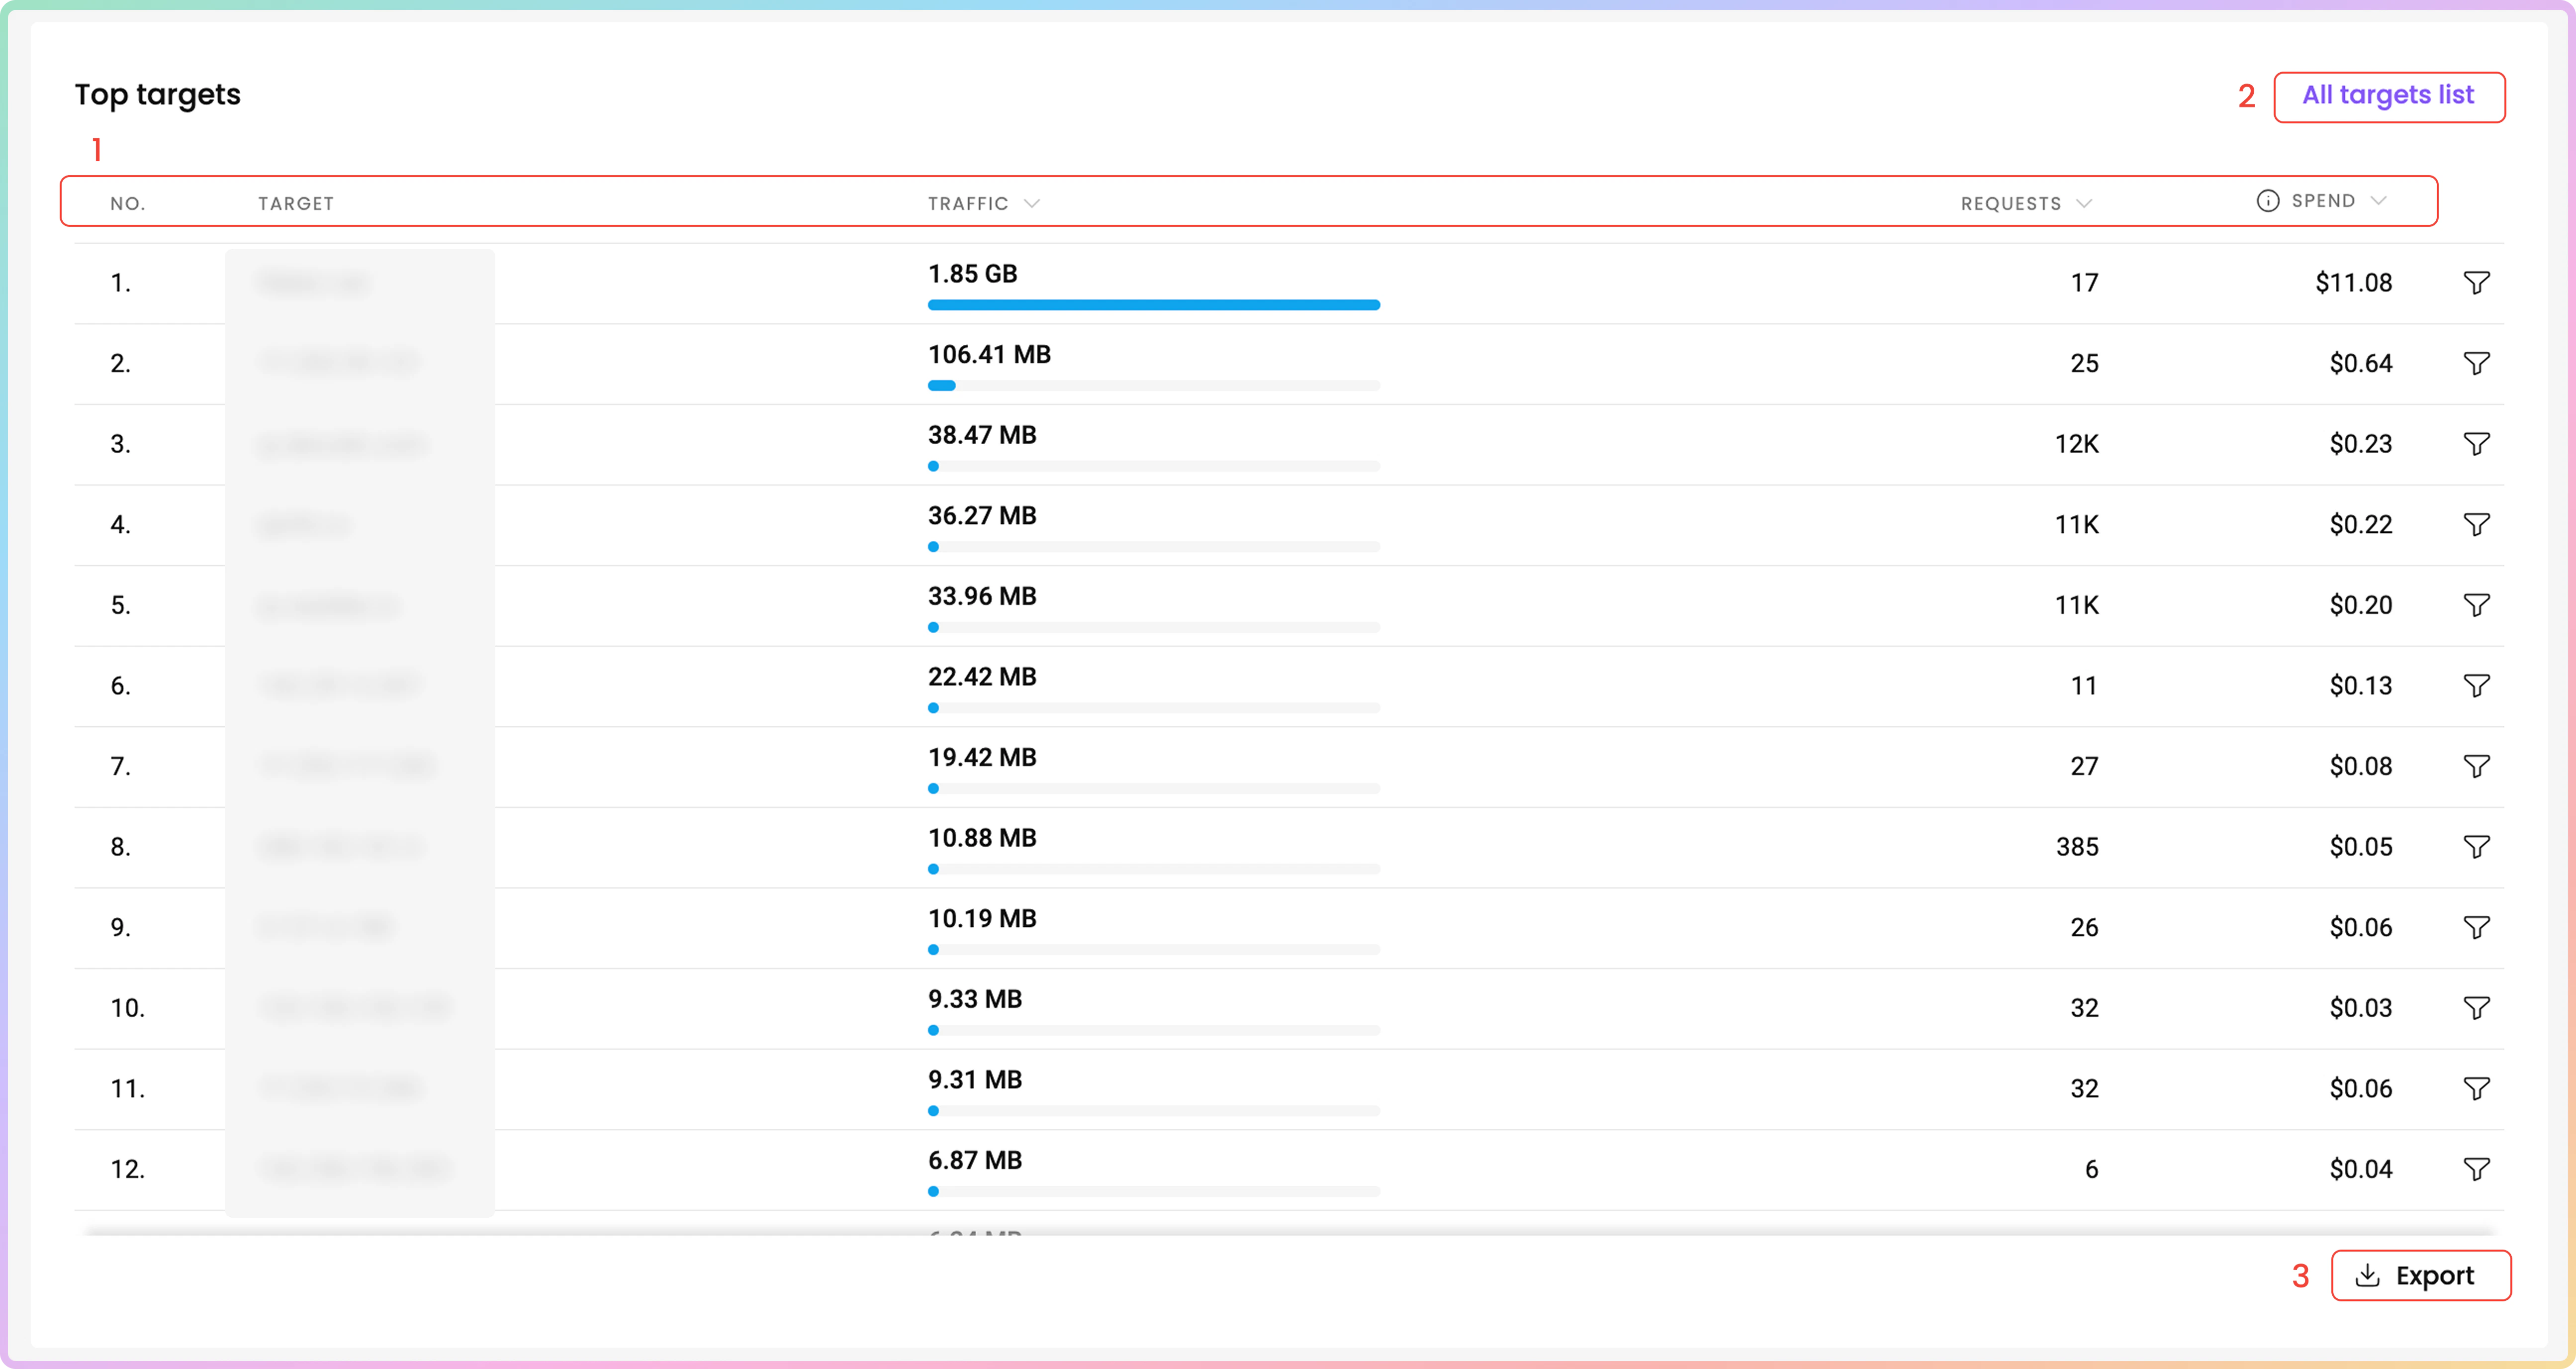
In the **Top targets** table, you can see the target domains, which you have accessed with the proxies, sorted by total traffic consumption in descending order.
1. You can find the **No.**, **Target**, **Traffic**, **Requests**, and **Spend** columns as well.
2. To view the full target list, click on the **All targets list** button located at the top right corner of the table.
* There, you can search the entire list by keywords.
Below are three additional data tables: **Top targets**, **Top countries**, and **Top users**.
### Top targets
In the **Top targets** table, you can see the target domains, which you have accessed with the proxies, sorted by total traffic consumption in descending order.
1. You can find the **No.**, **Target**, **Traffic**, **Requests**, and **Spend** columns as well.
2. To view the full target list, click on the **All targets list** button located at the top right corner of the table.
* There, you can search the entire list by keywords.  3. You can export the table's data directly or export the raw data in the following file formats: `.CSV`,.`TXT`, or `.JSON`. You can also copy the data to your clipboard.
 ***
### Top countries
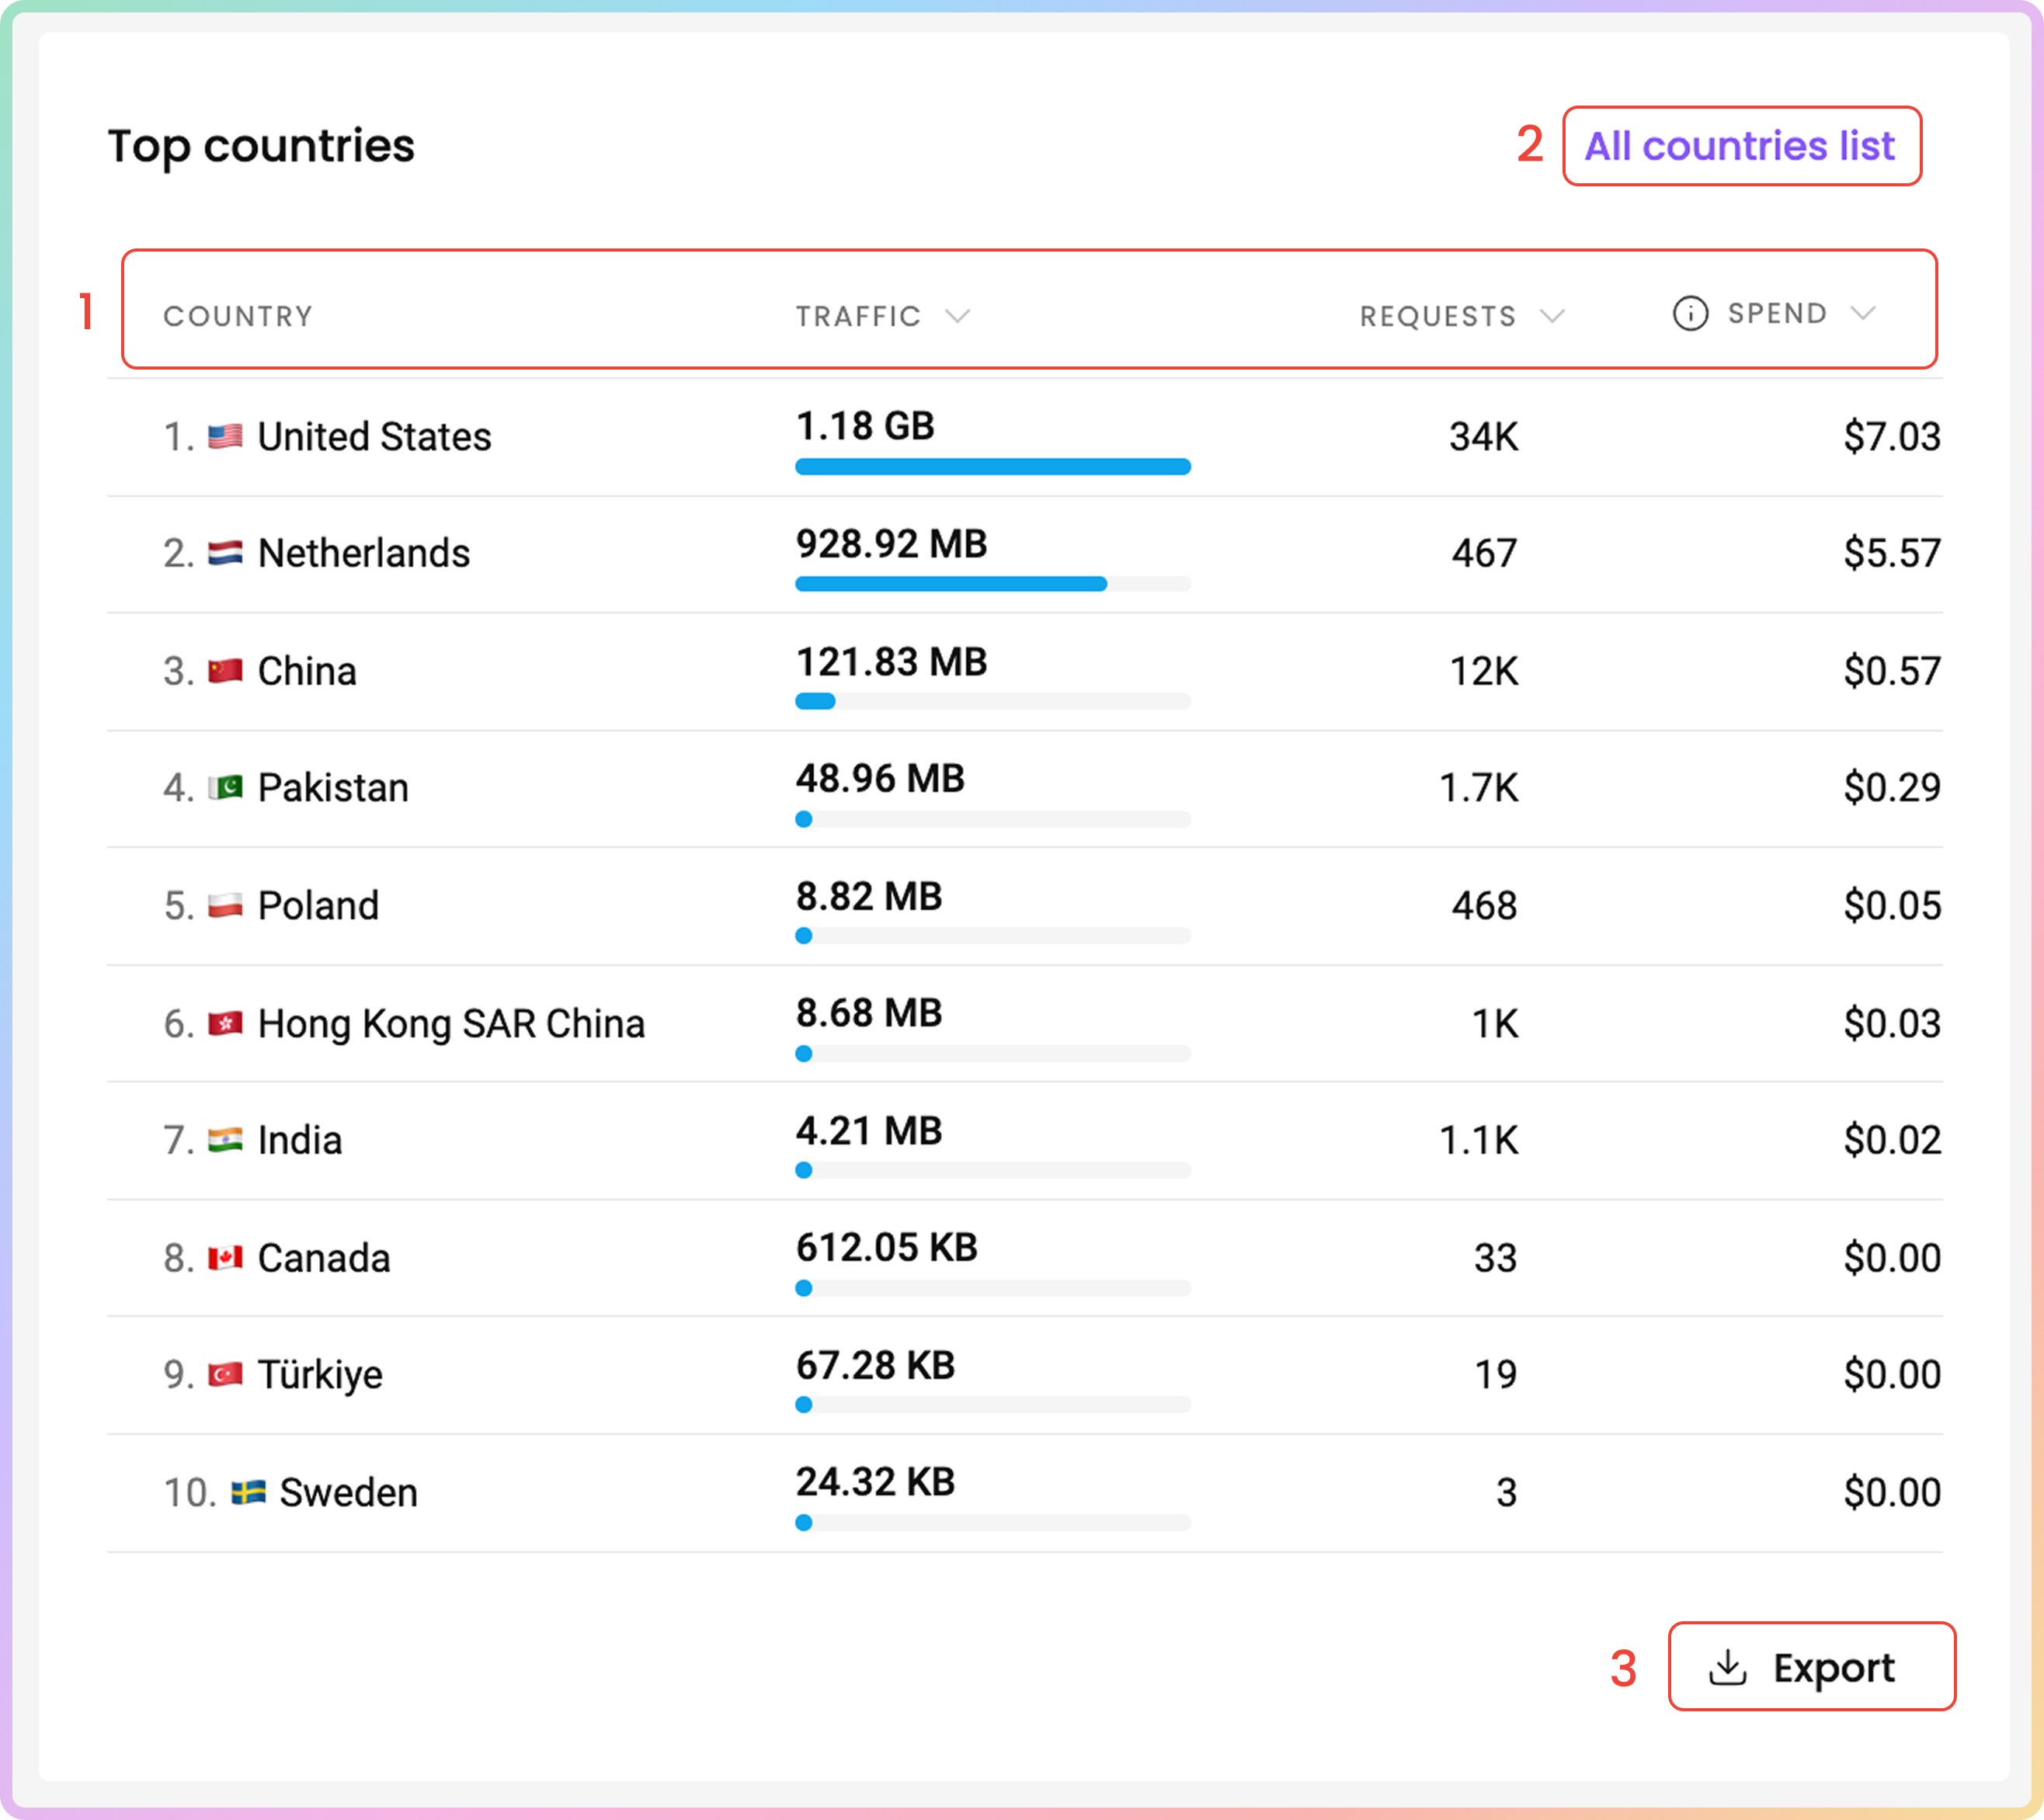
In the **Top countries** table, you can see the countries you have targeted with the proxies, sorted by total traffic consumption in descending order.
1. You can find the **Country**, **Traffic**, **Requests**, and **Spend** columns as well.
2. To view the full target list, click on the **All countries list** button located at the top right corner of the table.
* There, you can search the entire list by keywords.
***
### Top countries
In the **Top countries** table, you can see the countries you have targeted with the proxies, sorted by total traffic consumption in descending order.
1. You can find the **Country**, **Traffic**, **Requests**, and **Spend** columns as well.
2. To view the full target list, click on the **All countries list** button located at the top right corner of the table.
* There, you can search the entire list by keywords.  3. You can export the table's data directly or export the raw data in the following file formats: `.CSV`,.`TXT`, or `.JSON`. You can also copy the data to your clipboard.
 At the moment, statistics data based on other proxy parameters, such as the city, US state, ASN, and ZIP code is not available with Residential proxies.
***
### Top users
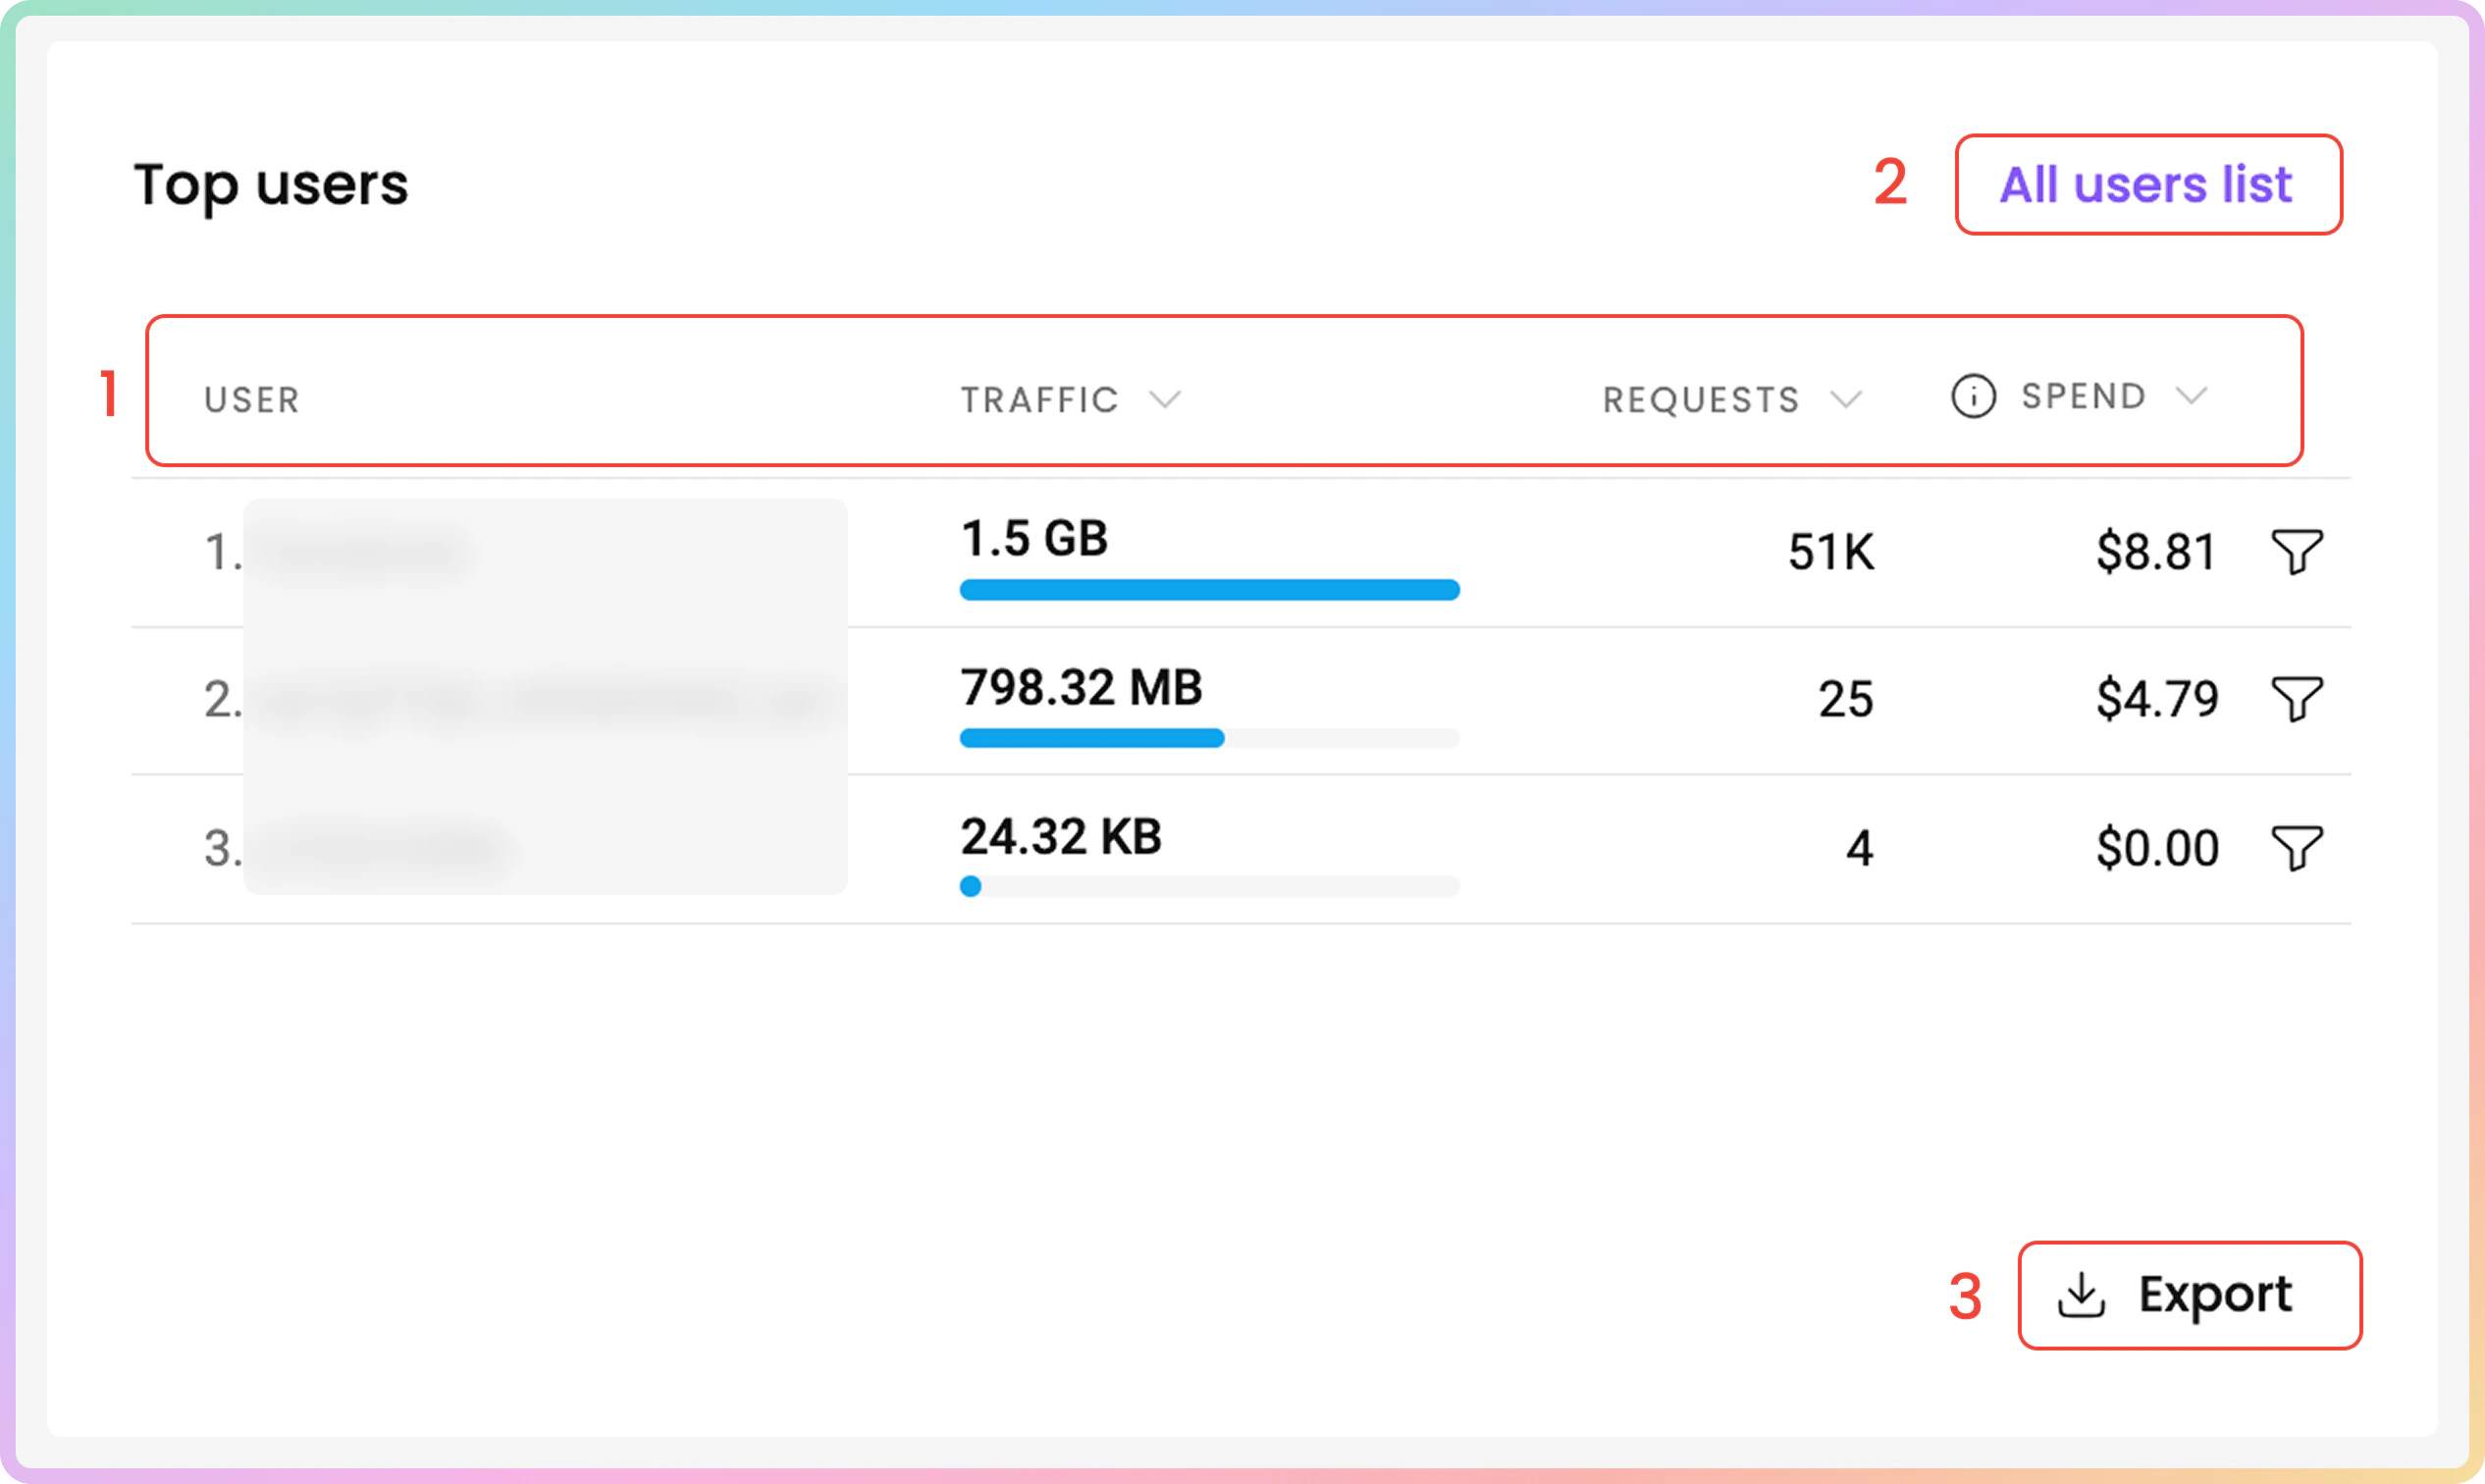
In the **Top users** table, you can see the used traffic of your proxy users and whitelisted IPs, sorted from highest to lowest.
The proxy traffic generated when **authenticating** via the **whitelisted IP** method is **aggregated**. That means sorting used traffic by different whitelisted IPs is not possible.
1. You can find the **User**, **Traffic**, **Requests**, and **Spend** columns as well.
2. To view the full target list, click on the **All users list** button located at the top right corner of the table.
* There, you can search the entire list by keywords.
At the moment, statistics data based on other proxy parameters, such as the city, US state, ASN, and ZIP code is not available with Residential proxies.
***
### Top users
In the **Top users** table, you can see the used traffic of your proxy users and whitelisted IPs, sorted from highest to lowest.
The proxy traffic generated when **authenticating** via the **whitelisted IP** method is **aggregated**. That means sorting used traffic by different whitelisted IPs is not possible.
1. You can find the **User**, **Traffic**, **Requests**, and **Spend** columns as well.
2. To view the full target list, click on the **All users list** button located at the top right corner of the table.
* There, you can search the entire list by keywords. 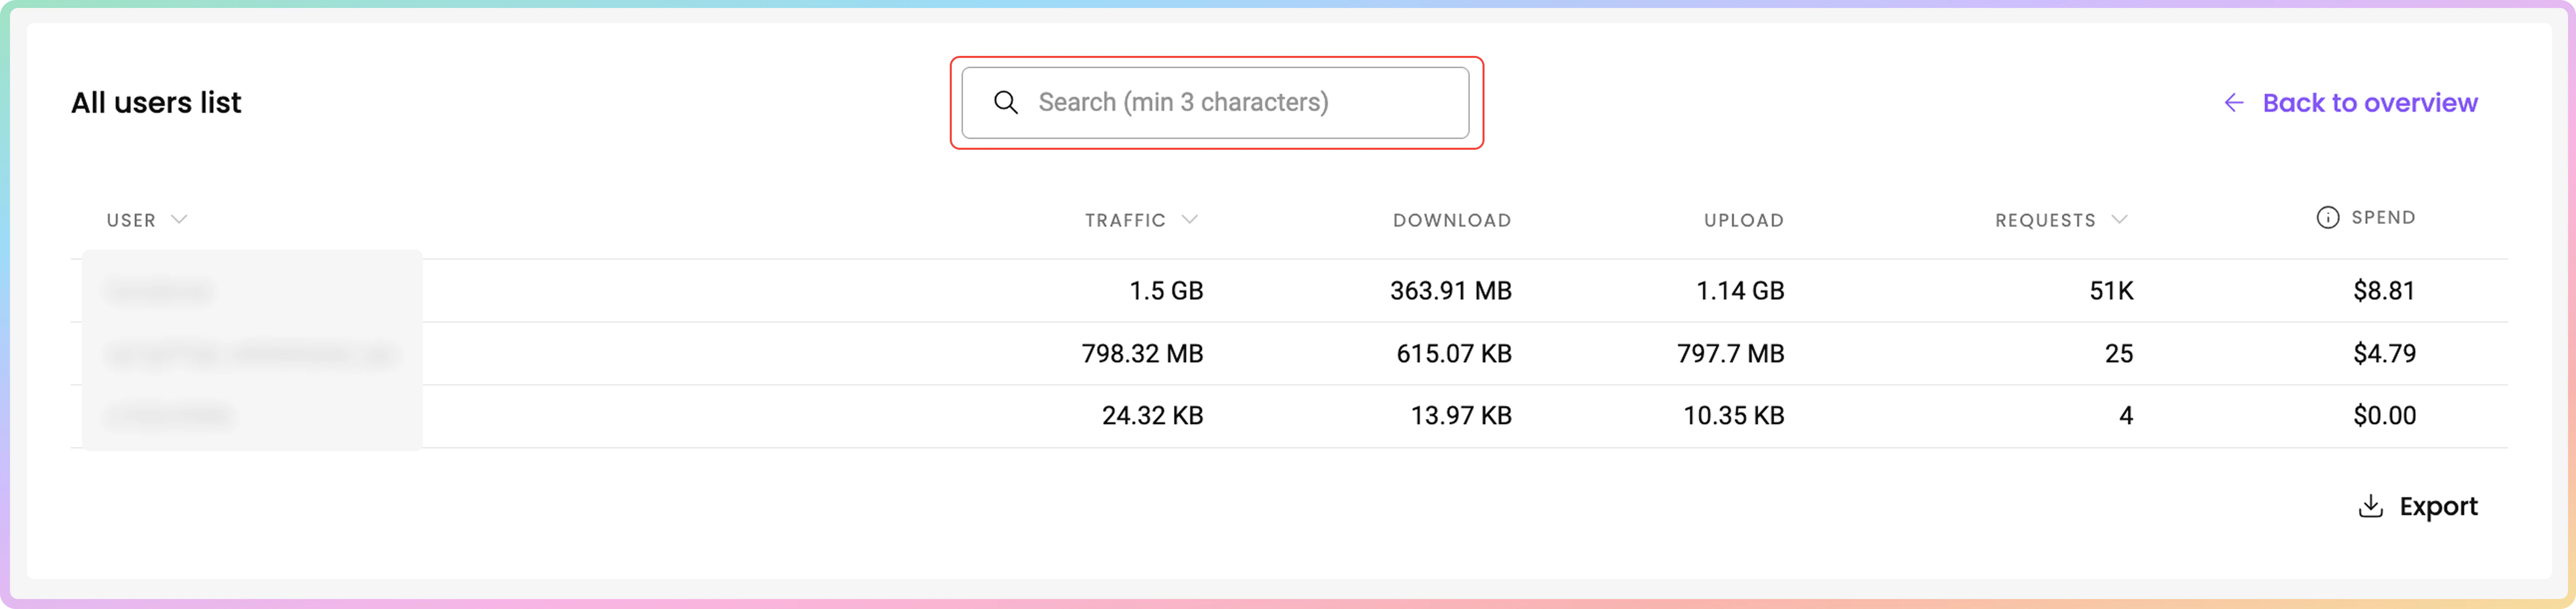 3. You can export the table's data directly or export the raw data in the following file formats: `.CSV`,.`TXT`, or `.JSON`. You can also copy the data to your clipboard.
 ***
## API
You can also retrieve the proxy traffic and usage details for free via the [**API**](https://help.decodo.com/api-reference/public-api-key-authentication).
### Get traffic
The following `POST` endpoint will allow you to receive used traffic information:
`https://api.decodo.com/api/v2/statistics/traffic`
You can adjust the request parameters based on the traffic you desire to receive. To find the list of all request parameters, head over to the [**Get traffic**](https://help.decodo.com/api-reference/traffic/get-traffic) API documentation page.
In the linked API documentation page, there are also request examples in various programming languages. To add, you can test the request by entering your API key in the **Authorization** field to the right after adjusting the **Body Params** section.
Here is an example of a `cURL` request via the **Get traffic** endpoint. If you wish to try the request, make sure to replace `` in line 3.
```shellscript cURL theme={null}
curl --request POST \
--url https://api.decodo.com/api/v2/statistics/traffic \
--header 'Authorization: ' \
--header 'accept: application/json' \
--header 'content-type: application/json' \
--data '
{
"proxyType": "residential_proxies",
"startDate": "2026-01-01 00:00:00",
"endDate": "2026-01-03 00:00:00",
"groupBy": "day",
"limit": 500,
"page": 1,
"sortBy": "grouping_key",
"sortOrder": "asc"
}
'
```
Here is the output from the previous request.
```json Response expandable theme={null}
{
"metadata": {
"total_items": 12,
"total_pages": 1,
"current_page": 1,
"sort_by": "grouping_key",
"sort_order": "asc",
"totals": {
"total_rx": 156807236,
"total_tx": 43852368,
"total_rx_tx": 200659604,
"requests": 2363,
"unsuccessful_requests": 0,
"response_time": 0,
"success_rate": 0
},
"limit": 100
},
"data": [
{
"key": "2026-01-01 00:00:00",
"rx_bytes": 8063533,
"tx_bytes": 246389,
"rx_tx_bytes": 8309922,
"requests": 80
},
{
"key": "2026-01-02 00:00:00",
"rx_bytes": 144899450,
"tx_bytes": 43572701,
"rx_tx_bytes": 188472151,
"requests": 2279
},
{
"key": "2026-01-03 00:00:00",
"rx_bytes": 3844253,
"tx_bytes": 33278,
"rx_tx_bytes": 3877531,
"requests": 4
}
]
}
```
### Get targets
The following `POST` endpoint will allow you to receive a list of target websites you've accessed with the proxies:
`https://api.decodo.com/api/v2/statistics/targets`
You can adjust the request parameters based on the targets you desire to receive. To find the list of all request parameters, head over to the [**Get targets**](https://help.decodo.com/api-reference/targets/get-targets) API documentation page.
In the linked API documentation page, there are also request examples in various programming languages. To add, you can test the request by entering your API key in the **Authorization** field to the right after adjusting the **Body Params** section.
Here is an example of a `cURL` request via the **Get targets** endpoint. If you wish to try the request, make sure to replace `` in line 3.
```shellscript cURL theme={null}
curl --request POST \
--url https://api.decodo.com/api/v2/statistics/targets \
--header 'Authorization: ' \
--header 'accept: application/json' \
--header 'content-type: application/json' \
--data '
{
"startDate": "2026-01-01 00:00:00",
"endDate": "2026-01-26 00:00:00",
"proxyType": "residential_proxies"
}
'
```
Here is the output from the previous request.
```json Response expandable theme={null}
{
"metadata": {
"total_items": 5,
"total_pages": 1,
"current_page": 1,
"totals": {
"total_rx": 0,
"total_tx": 0,
"total_rx_tx": 0,
"requests": 0,
"unsuccessful_requests": 0,
"response_time": 0,
"success_rate": 0
},
"limit": 0
},
"data": {
"targets": [
"ads.mozilla.org",
"detectportal.firefox.com",
"filebin.net",
"incoming.telemetry.mozilla.org",
"ip.decodo.com"
]
}
}
```
***
## Unrecognized Usage in Statistics
### Unfamiliar Target Websites
If you see an unfamiliar target on your statistics page, keep in mind that it may be a **subdomain** of the websites you are targeting. This means the target website uses subdomains to organize separate sections of content or services. The dashboard **tracks** these **subdomains** as well.
### Unexpected Traffic Consumption
* If you notice a higher traffic usage with the proxies, note that the traffic may have been consumed by **applications** running and updating in the **background** while you're using the proxies.
* Additionally, **target** **websites** could have **changed** and introduced new **content**, which would impact the proxy traffic.
* Generally, it's advised to generate a new **password** for your **proxy users periodically**.
* Don't forget to **turn off** the **tool** or **program** you are using to run the proxies after you're done using them.
Look at [**High traffic usage**](https://help.decodo.com/docs/high-traffic-usage) for a more detailed understanding of traffic discrepancies.
***
Need help or just want to say hello? Our support is available 24/7. \
You can also reach us anytime via email at [support@decodo.com](mailto:support@decodo.com).
Can't find what you're looking for? Request an article! \
Have feedback? Share your thoughts on how we can improve.
***
## API
You can also retrieve the proxy traffic and usage details for free via the [**API**](https://help.decodo.com/api-reference/public-api-key-authentication).
### Get traffic
The following `POST` endpoint will allow you to receive used traffic information:
`https://api.decodo.com/api/v2/statistics/traffic`
You can adjust the request parameters based on the traffic you desire to receive. To find the list of all request parameters, head over to the [**Get traffic**](https://help.decodo.com/api-reference/traffic/get-traffic) API documentation page.
In the linked API documentation page, there are also request examples in various programming languages. To add, you can test the request by entering your API key in the **Authorization** field to the right after adjusting the **Body Params** section.
Here is an example of a `cURL` request via the **Get traffic** endpoint. If you wish to try the request, make sure to replace `` in line 3.
```shellscript cURL theme={null}
curl --request POST \
--url https://api.decodo.com/api/v2/statistics/traffic \
--header 'Authorization: ' \
--header 'accept: application/json' \
--header 'content-type: application/json' \
--data '
{
"proxyType": "residential_proxies",
"startDate": "2026-01-01 00:00:00",
"endDate": "2026-01-03 00:00:00",
"groupBy": "day",
"limit": 500,
"page": 1,
"sortBy": "grouping_key",
"sortOrder": "asc"
}
'
```
Here is the output from the previous request.
```json Response expandable theme={null}
{
"metadata": {
"total_items": 12,
"total_pages": 1,
"current_page": 1,
"sort_by": "grouping_key",
"sort_order": "asc",
"totals": {
"total_rx": 156807236,
"total_tx": 43852368,
"total_rx_tx": 200659604,
"requests": 2363,
"unsuccessful_requests": 0,
"response_time": 0,
"success_rate": 0
},
"limit": 100
},
"data": [
{
"key": "2026-01-01 00:00:00",
"rx_bytes": 8063533,
"tx_bytes": 246389,
"rx_tx_bytes": 8309922,
"requests": 80
},
{
"key": "2026-01-02 00:00:00",
"rx_bytes": 144899450,
"tx_bytes": 43572701,
"rx_tx_bytes": 188472151,
"requests": 2279
},
{
"key": "2026-01-03 00:00:00",
"rx_bytes": 3844253,
"tx_bytes": 33278,
"rx_tx_bytes": 3877531,
"requests": 4
}
]
}
```
### Get targets
The following `POST` endpoint will allow you to receive a list of target websites you've accessed with the proxies:
`https://api.decodo.com/api/v2/statistics/targets`
You can adjust the request parameters based on the targets you desire to receive. To find the list of all request parameters, head over to the [**Get targets**](https://help.decodo.com/api-reference/targets/get-targets) API documentation page.
In the linked API documentation page, there are also request examples in various programming languages. To add, you can test the request by entering your API key in the **Authorization** field to the right after adjusting the **Body Params** section.
Here is an example of a `cURL` request via the **Get targets** endpoint. If you wish to try the request, make sure to replace `` in line 3.
```shellscript cURL theme={null}
curl --request POST \
--url https://api.decodo.com/api/v2/statistics/targets \
--header 'Authorization: ' \
--header 'accept: application/json' \
--header 'content-type: application/json' \
--data '
{
"startDate": "2026-01-01 00:00:00",
"endDate": "2026-01-26 00:00:00",
"proxyType": "residential_proxies"
}
'
```
Here is the output from the previous request.
```json Response expandable theme={null}
{
"metadata": {
"total_items": 5,
"total_pages": 1,
"current_page": 1,
"totals": {
"total_rx": 0,
"total_tx": 0,
"total_rx_tx": 0,
"requests": 0,
"unsuccessful_requests": 0,
"response_time": 0,
"success_rate": 0
},
"limit": 0
},
"data": {
"targets": [
"ads.mozilla.org",
"detectportal.firefox.com",
"filebin.net",
"incoming.telemetry.mozilla.org",
"ip.decodo.com"
]
}
}
```
***
## Unrecognized Usage in Statistics
### Unfamiliar Target Websites
If you see an unfamiliar target on your statistics page, keep in mind that it may be a **subdomain** of the websites you are targeting. This means the target website uses subdomains to organize separate sections of content or services. The dashboard **tracks** these **subdomains** as well.
### Unexpected Traffic Consumption
* If you notice a higher traffic usage with the proxies, note that the traffic may have been consumed by **applications** running and updating in the **background** while you're using the proxies.
* Additionally, **target** **websites** could have **changed** and introduced new **content**, which would impact the proxy traffic.
* Generally, it's advised to generate a new **password** for your **proxy users periodically**.
* Don't forget to **turn off** the **tool** or **program** you are using to run the proxies after you're done using them.
Look at [**High traffic usage**](https://help.decodo.com/docs/high-traffic-usage) for a more detailed understanding of traffic discrepancies.
***
Need help or just want to say hello? Our support is available 24/7. \
You can also reach us anytime via email at [support@decodo.com](mailto:support@decodo.com).
Can't find what you're looking for? Request an article! \
Have feedback? Share your thoughts on how we can improve.